Harmonize or Control? The Use of Multilevel Analysis to Analyze Trust in Institutions in the World
by Claire Durand, Isabelle Valois and Luis Patricio Peña Ibarra, Department of Sociology, University of Montreal
This article presents the current progress of a research project whose aim is to develop methods to analyze combined micro-data. The most recent papers that were presented (see references) give an insight into the work that has been accomplished to date.
This project was triggered by a preceding project where we aimed at analyzing change in support for Quebec sovereignty over time taking into account that question wordings and specific constitutional choices offered in survey questions varied over time and between surveys. We had identified close to 700 questions asked in polls over a 40-year period. In order to analyze these data, we used a multilevel model where polls were embedded within months. This allowed for analyzing the impact of question characteristics at level 1. Since time itself was at level 2, we could study change in support for sovereignty over time and the impact of events that occurred during each period controlling for question wording and constitutional choices (Yale & Durand, 2011).
This research ended with a frustration. We would have liked to be able to answer questions like whether the impact of age on support for sovereignty was fading over time. This requested combining micro-data, not just poll results. Therefore, we decided to combine data sets in order to be able to answer our research questions. However, instead of maintaining the focus on Quebec sovereignty, the focus was changed to institutional trust.
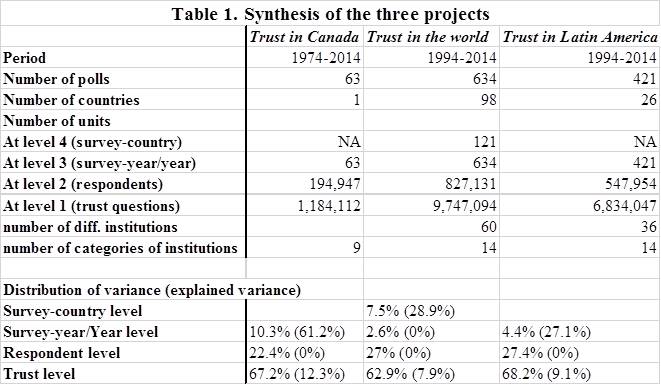
The first project is Valois’s Trust in Canada which involves combining survey data over a 40-year period; the second and third project started with the objective of combining all the surveys that had questions on trust in institutions everywhere in the world. One project is Durand et al.’s Trust in the World who combined the data from all the Barometers conducted outside Europe and the Latin American Public Opinion Project (LAPOP) surveys; the other one is Peña Ibarra’s Trust in Latin America, which uses a subset of these data to focus on Central and South America plus Mexico. The basic information on the three projects is presented in Table 1.
Valois’s Trust in Canada Project
The first project is Isabelle Valois’ doctoral research. Valois’ first goal was to examine the hypothesis of a decline in trust over time in Canada. While it is rather easy to find data on trust in Europe or in the U.S., it is much more difficult to find similar data for Canada. As a first step, Valois tried to identify all the surveys that had questions pertaining to trust in institutions in Canada. She managed to find 63 surveys conducted from 1974 to 2014 – some of them from International survey programs like the World Values Survey (WVS), the International Social Survey Programme (ISSP) and LAPOP. Valois ran into a number of problems related to the variation in the questions pertaining to trust and to socio-demographic characteristics:
Concerning the questions on trust,
- First, there was variation between surveys and over time in the institutions on which the trust questions were asked.
- Second, the question wordings varied also. In English, some used the term “trust”, others, the term “confidence” (in French, there is only one term, confiance). In addition, some questions asked about the institutions themselves, other about the leaders of these institutions – “the people in charge of” – and others about the employees, i.e., teachers instead of the school system, for example. These differences in wordings may have an impact on the level of trust reported and therefore, should be controlled for.
- Third, the number of choices in the scales used to measure trust also varied.
At the individual level,
- Variables like age, education, and income had to be harmonized to a smaller common denominator. However, since the period is long – 40 years – categories may change meanings over time. Being less than 34 years old for example, may not have meant the same thing when this age group comprised close to 50% of the population (in the 1970’s) compared to less than 30% more recently. One aim was therefore to be able to take into account the varying composition of the population.
While there is not much choice but to use the smallest common denominator when it comes to socio-demographic characteristics, the situation is different with the trust questions. The decision was taken to enter the information as it was found in the original data files and to introduce variables that inform on the type of question wording and the number of anchors in the scales used, a solution that had been used in the Change in Support for Sovereignty project. This meant putting all the answers on a “largest common denominator” scale, i.e., a 7-point scale. The 4-point scales were recoded into 1, 3, 5, 7, the 3-point scales into 2, 5, 6, etc. and each survey was coded on the type of scale originally used.
The second major problem to deal with was whether it was necessary to “harmonize” right away the different institutions. New institutions kept appearing with any new survey entered in the data base. The solution to that problem was not found right away. The second project allowed to solve it and the solution was applied a posteriori to Valois’s Trust in Canada project.
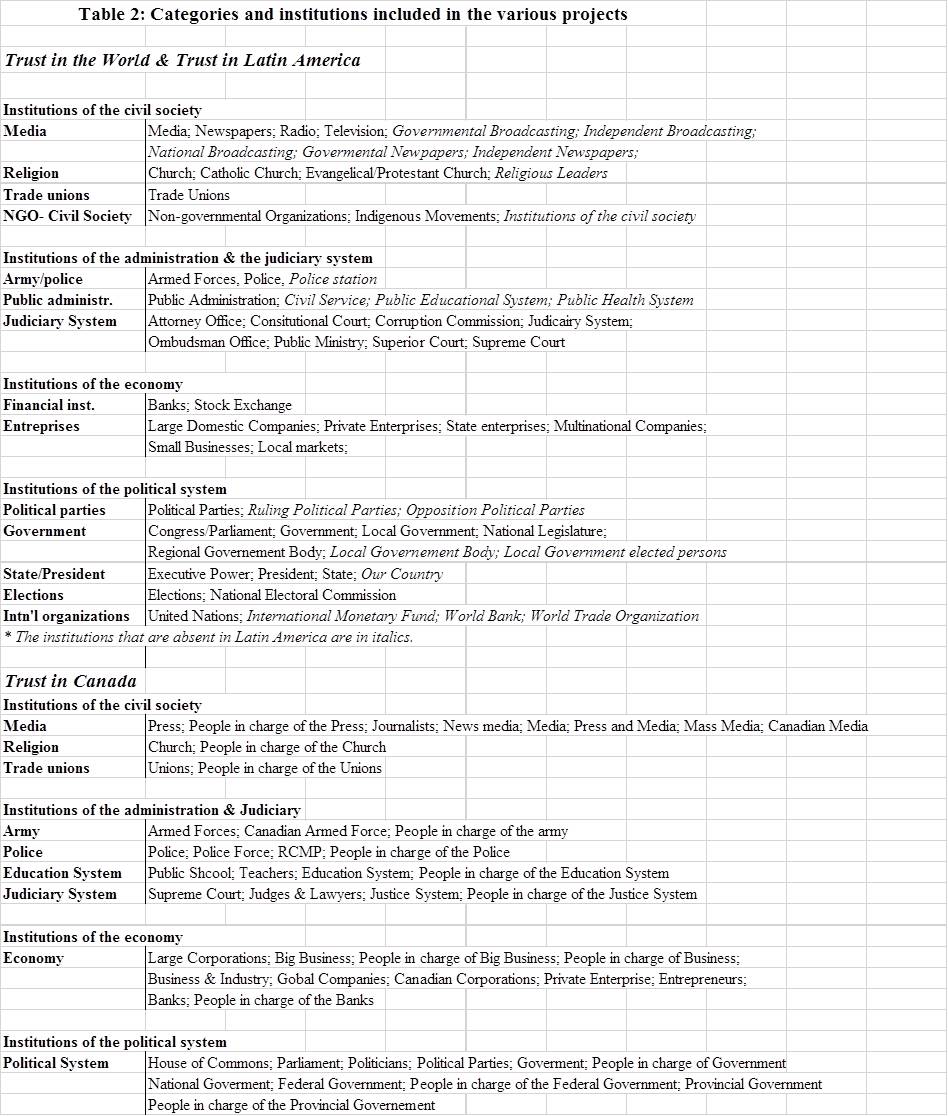
The combined data base of 63 surveys for this project comprises 194,947 respondents with a total of 1,184,112 measures, i.e., an average of 6.07 items answered per respondent. These measures pertain to trust in up to 49 institutions, grouped into nine categories (see Table 2 for a description of the institutions and categories in which they are grouped). The pooled data were analyzed with a 3-level longitudinal multilevel model of repeated measures. Polls are at the highest level. It is at that level that the impact of time and of events can be tested. Respondents are at level 2. The possible impact of age, sex, and region is analyzed at this level. Answers to questions on trust are level 1. This allows for analysing the impact of the object of trust – the different institutions – on the level of trust. Valois (2016a, 2016b) shows that, although there was no decline in overall trust during the period, trust in specific institutions did change. Trust in religion, for example, declined during the period while trust in the army started increasing after 9/11. Valois also shows that trust in the political institutions in Canada declined much during the period of intense constitutional debate that preceded the Quebec referendum on sovereignty in 1995. Afterwards, it increased back to its pre-crisis level and even higher.
The Durand, Peña Ibarra and Charest Project
Following the problems regarding the multiplication of the number of institutions encountered in the Valois project, it became obvious that it was necessary to develop and test methods that could allow for an analysis of combined survey results that take into account the substantial variation in the institutions on which trust questions were asked.
We proceeded to combine the data sets of all the Barometers, giving precedence to the Barometers conducted outside Europe. We combined the Latino Barometro, the Asian and East Asian Barometers, the Africa Barometer and the Arab Barometer. In doing so, we added a new variable each time a new institution appeared in a data file. For example, in the Latino Barometro, there was a question on trust in the Church, but in the Arab Barometer, a similar question pertained to trust in religious leaders. This information was kept as two questions. In this way, all the original information was kept in our combined data base. We then decided to add the data from LAPOP that had questions similar to the Latino Barometro but used 7-anchor scales. Finally, we withdrew the data from the United States and Canada present in LAPOP and the data from Spain present in the Latino Barometro so as to restrict ourselves to the regions for which we had data from many countries.
This combined file finally comprises 635 surveys from four regions of the world, i.e., Latin America, Asia, Africa and the Middle East and North Africa (MENA), conducted from 1994 to 2014. These surveys were conducted in 98 countries. Since surveys were conducted over 20 years (for the longest stretch), it gives us 560 country-years. There are 827,131 respondents in the combined data file and answers to 9,747,094 questions, an average of 11.8 per respondent, pertaining to trust in 60 different institutions.
- At the first level, there are the different answers given by respondents to the trust questions. These answers are embedded within each respondent so that the fact that a single respondent answered the different questions is controlled for. Each of these answers is coded for the institution on which the trust question is asked. Table 2 shows how the 60 different institutions were categorized into 14 groupings for analysis. The advantage of grouping institutions a posteriori instead doing so from the outset is triple: First, we can check whether there are differences between the different institutions that are grouped together a priori; we can modify the groupings as needed; and finally, if new institutions appear when we combine new data files, they can be either integrated in the current categories or new categories can be introduced.
- At the second level, there are respondents. There is not that much common information on the respondents present in all the data files. Age or age categories and sex are present in all the surveys. Education is present in all but seven of them. The harmonized categories are: no formal education, primary school, secondary school/high school, professional/technical school and university/graduate school. Measures of occupation are present for 77% of the respondents, with the following harmonized categories: employed, including self-employed and salaried, out ofwork, retired, homemaker, student and other.
- At the third level, there is time. Since it is possible that a curvilinear relationship is present, two variables were computed, time (centered on the mean) and time squared. Having a separate level for time has very interesting advantages. It allows for checking hypotheses regarding a differential change in trust over time for different institutional categories or whether differences according to age for example decrease over time.
- Finally, at the fourth level, there is each country. The 98 countries are categorized according to region of the world, i.e. Latin America, Asia, Africa and MENA. In addition, at that level, we control for the impact of using a 7-point scale in LAPOP instead of a 4-point scale. This requires us to keep the Latino Barometro and LAPOP files in separate units for the same countries. Therefore, we have 121 units at that level.
A first presentation of this analysis can be found in Durand, Charest, Peña Ibarra & Valois (2016a) and Durand, Charest & Peña Ibarra (2016a, 2016b) for 3-level and 4-level models. This project showed that political parties get the lowest level of trust in all regions of the World and that trust is generally lower in Latin American than elsewhere. It also showed that there was a decrease in trust in some institutions in the MENA countries following the invasion of Iraq. However, on average, the level of trust did not change much over time. Finally, it allowed for determining that the difference in average trust according to age groups was fading over time.
The next steps of this project are the following:
- We would like to integrate variables that characterize the different countries over time. These can be economic or socio-political indicators. We face the problem of finding indicators that are available and comparable for all countries and periods.
- Second, we would like to integrate the data files from the World Values Survey and the International Social Survey Programme on religion in 1998 and 2008 in which there are questions pertaining to trust.
- Finally, we will go on combine new data files from all the projects as they become available.
The Peña Ibarra Project
Luis Peña Ibarra was the main research assistant who combined all the files for the international project. For his doctoral research, he decided to focus on a subset of that project, i.e., South and Central America, and therefore on the combination of the Latino Barometro and LAPOP projects. Focussing on a specific region has two advantages. First, the trust questions have more comparability. For example, trust in Church means quite the same thing in all South and Central America. In addition, a number of socio-demographic variables are also more comparable. The second advantage is that it makes it easier to find macro level indicators that characterize each country over time.
The combined file pertains to 26 countries with data from 1994 to 2014. The restricted number of countries makes it impossible to use a 4-level model. The highest level comprises 421 units at the level of country-survey-year. It comprises 547,954 respondents with answers on a total of 6,834,047 questions of trust in institutions, an average of 12.5 questions per respondent. Table 2 shows the 36 institutions that are present in this data file.
Peña Ibarra et al. (2016) could show that trust is stable on average because there are compensation mechanisms, i.e., when trust in the Church decreases, trust in the media increases. At the country-year level, he tested whether belonging to a common economic market — like the Mercado común del sur (MERCOSUR), the Mercado común centroamericano (MCCA) and the Comunidad económica del Caribe (CARICOM) — and whether the ideological orientation of the government – from right to left – were related to trust. He could show that when left-wing parties form the government, the level of trust is, on average, 0.14 points higher on a seven-point scale.
Analysis
The lower part of Table 1 presents the distribution of the variance at the different levels for the three projects and, in parenthesis, the variance that has been explained by the independent variables entered. It is interesting to notice the similarity in the distribution of variance between projects. The variance at the trust level – between institutions within individuals – varies from 63% to 68%. It is lower when there are more countries, which is expected since the many different contexts take some variance. Between 8% and 12% of that variance is explained by the different institutions and the variation in trust according to region and time for these institutions. The fact that two-thirds of the variation is between institutions means that analysing only one measure of trust or a mean of different measures would not have been appropriate.
Between 22% and 27% of the variance is found between individual respondents. At this stage, the variables used to explain this variance are age and sex (and region in Canada). Sex is significant only in the case of Canada. Region is also significant in Canada. Age is significant in all three files. However, the contribution of these variables is not substantial enough to explain a significant amount of the variance.
At the survey-year level, there are expected differences between projects. In Canada, there is data for only one country but over a 40-year period with surveys that come from very diverse sources. This is where the variance between surveys is highest at 10.3%. In Latin America, there are 26 countries surveyed over 20 years. There is no substantial variation over time. The variance at that level is 4.4% and 27% of it is explained, mostly by the ideological orientation of the government and by the type of scale used (7-anchor vs 4-anchor). The Trust in the World project is the only one with four levels. Most of the variance is between countries, but not between years. This confirms that trust is, on average, quite stable over time unless a specific event has an impact on trust in a specific organization or unless trust a specific organization is declining (Church in Latin America and in Canada, for example). At the country level, there is 7.5% of the variance, which is not much. This variance can be explained by region and by the scale used to measure trust. In general, using a 7-anchor scale gives an estimation close to half a point higher.
Discussion and Conclusion
In this project, we decided that it was better to “go-around” the problem of harmonization of data instead of grouping items of trust in institutions that focus on similar institutions in large categories or keeping only items that were common across all surveys. It became obvious from the beginning, in the Valois Trust in Canada project, that harmonizing the trust questions meant losing much information. In addition, every new file brought new problems to solve. ‘Going around’ meant finding ways to analyse the data as is and control a posteriori for the fact that different scales and question wordings were used and that different institutions were surveyed.
We would like to improve our understanding of the variance that is found at the different levels. For example, we could not yet explain much variance between countries and at the individual level. We will need to find indicators that are available for all countries and year and are related to trust. At the individual level, unfortunately, there is not much information that we can add. However, analysis performed with education, though it forces us to withdraw seven surveys, show that this is the major new indicator to add into the analyses.
Finally, we would like to let researchers have access to these files. However, legal problems may restrict our capacity to do so. We depend on the cooperation from the various projects in finding ways to let researchers access the harmonized data files. We will work towards solving this problem in order to be able to share our work.
References
Durand, C., Peña Ibarra, L. & A.S. Charest (2016a). L’évolution de la confiance dans les institutions, une analyse transnationale, multiniveaux et longitudinale. 9ème Colloque francophone sur les sondages, Gatineau, Québec, 11-14 octobre, 2016. Text : 3-level analysis: http://paperssondages16.sfds.asso.fr/submission_41.pdf; Diaporama: 4-level analysis : http://sondages2016.sfds.asso.fr/wp-content/uploads/2016/10/Session05-Durand.pdf
Durand, C., Charest, A.S., Valois, I. & L.P. Pena Ibarra (2016a). A Transnational Analysis of Change in Trust over Time. WAPOR 69th Annual Conference, Austin, Texas, May 10-12, 2016. http://www.mapageweb.umontreal.ca/durandc/Recherche/Publications/Combining_data/Transnational_analysis.pdf
Durand, C. Charest, A.S., Valois, I. & L.P. Pena Ibarra (2016b). The use of longitudinal multilevel models to understand change in trust in institutions over time and between countries, Presented at the ISA-RC33 Conference, September 11-16, 2016.
Durand, C. et I. Valois (2015). Pour une analyse historique des données d’enquête: Le cas de la confiance au Canada, Conférence organisée par la Société Statistique de Montréal (SSM) et la Faculté des Sciences de l’Éducation de l’Université de Montréal, 17 Novembre 2015.
Durand, C., I. Valois & F. Yale (2015). Historical Analysis of Survey Data and Survey Results: The Incredible Possibilities Afforded by Longitudinal Multilevel Analysis Using Time at a Higher level, European Survey Research Association 6th conference, Reykjavik, Iceland, July 13-17, 2015. http://www.mapageweb.umontreal.ca/durandc/Recherche/Publications/Combining_data/Historical_analysis.pdf
Peña Ibarra, L.P., Durand, C., Charest, A.S. & I. Valois (2016). ¿Crisis de confianza en las instituciones en América Latina? VII Congreso WAPOR Latino América, Monterrey, México, 12-14 octubre, 2016.
Valois, I. (2016a). La confiance envers les institutions au Canada est-elle en diminution? Une analyse longitudinale Text: http://paperssondages16.sfds.asso.fr/submission_70.pdf; Diaporama: http://sondages2016.sfds.asso.fr/wp-content/uploads/2016/10/session_5_Valois.pptx
Valois, I. (2016b). Is institutional confidence in Canada declining? A longitudinal analysis, WAPOR Political Trust in Contemporary Representative Democracies, Barcelona, Spain, November 24-25, 2016.
Yale, F. & C. Durand (2011). What did Quebeckers want? Evolution of Support for Sovereignty1976-2008. American Review of Canadian Studies, 42 (3), p. 242-258.
Professor Claire Durand, Isabelle Valois and Luis Patricio Peña Ibarra are at the Department of Sociology, University of Montreal. The presentations from this article are available on ResearchGate or on Claire Durand’s website http://www.mapageweb.umontreal.ca/durandc
This article is also available in the latest issue of Harmonization: Newsletter on Survey Data Harmonization in the Social Sciences