Survey Weights as Indicators of Data Quality
“Survey Weights as Indicators of Data Quality” by Marta Kolczynska, Marcin W. Zielinski, and Przemek Powalko appears in Harmonization newsletter (Summer 2016, v2 n1)
In the last decades, more and more scholars are using weights as a procedure for correction of distortions in surveys. The improvement in the quality of the data using weights is conditional upon the quality of the weights themselves, as well as their ability to correct the discrepancies between the realized sample and the population. In cross-national research, especially when combining survey data from different survey projects, the additional challenge is making sure across national samples, the quality of the weights and the quality of weighted data are comparable and allow for meaningful analyses of the combined data.
Over time, weighting data has gained popularity as a way of dealing with sampling and non-responses errors.
We propose four properties of weights that can be considered as both indicators of their quality, and also as indicators of the quality of the data in terms of the degree of distortion between the targeted sample and the achieved sample. First, the mean value of weights in a sample should be equal to 1; otherwise weighting the data would change the sample size and thus artificially alter standard errors and confidence intervals and lead to unfounded conclusions of hypothesis testing. Second, while weights usually lead to an increase in variance in the data, weights with a smaller variance are generally preferred over weights with greater variance. Weight variance depends on the discrepancy between the achieved sample and the population, or the extent to which the raw data need to be corrected to represent the population. Thus, in some sense, the weight variance can be assumed as a rough indicator of the quality of the sample. Finally, to avoid case exclusion and the loss of information, weights should have values greater than 0. If a weight would take the value 0, that case would be excluded from analyses. Extreme values should be avoided because they lead to potential bias if the individuals who have been assigned very high weights are specific, unusual, and deviating from the average.
We present some of our findings from the analysis of these properties, as well as mean variance, minimum and maximum value, of weights in 22 international survey projects conducted between 1966 and 2013 in 142 countries and territories. The database contains 1,721 national surveys; for detailed information about the project see dataharmonization.org. To start, we analyzed the availability of weights in our database and found them in 60.2 percent (n=1,035) of all surveys. Over time, weighting data has gained popularity as a way of dealing with sampling and non-responses errors. The main increase in the adoption of weights happened in late 1990s and early 2000s. In general, it is clear that the availability of weights has been increasing with time.
Mean
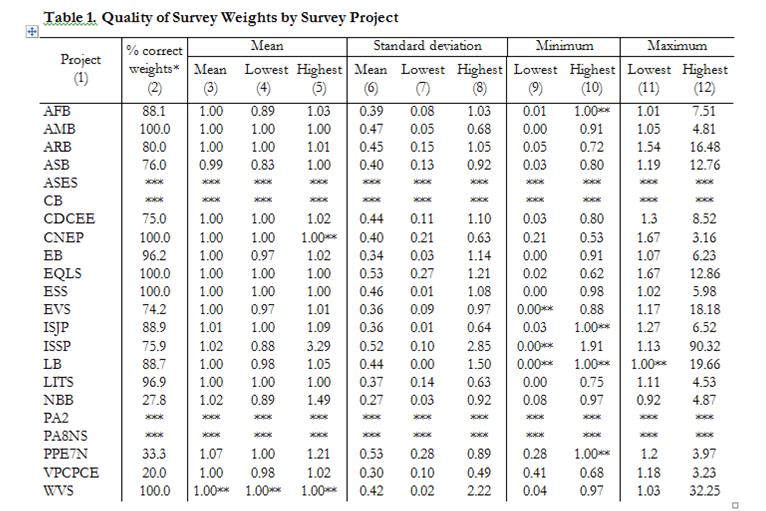
Of all samples in the Harmonization project that have weights, 70 percent do not meet the criterion of the mean of weights equal to 1. Since small deviations of the mean from 1 could be the result of rounding, we also took a less strict approach and considered weights to be correct if the deviation was less than 0.001. Using this definition, we find that of the 22 projects, only five have all surveys with correctly calculated means: AMB, CNEP, EQLS, ESS and WVS. On the other hand, only 20 percent of surveys in VPCPCE and 27 percent in NBB have weights that meet this criterion. When looking at surveys from all projects together, in 12.7 percent of national surveys the mean of weights exceeds the specified range of 0.999 to 1.001, with values ranging from 0.83 (Philippines, ASB 2010) to 3.29 (Philippines, ISSP 1996).
Standard Deviation
There is no set value for the highest acceptable value of standard deviation (i.e. benchmarks do not exist). In practice, and from the perspective of data weighting, we argue that the lower the standard deviation, the better. Our analysis shows that standard deviation ranges from 0.00 (Panama, Latinobarometro, 2002) to 2.85 (New Zealand, ISSP, 2007 with an average value of 0.43.
Interestingly, we found an association between the standard deviation of weights and the population density. This means that in countries where the population density is lower, the level of discrepancy between sampled (and thus between population) and achieved samples is bigger. This can indicate some problems with reaching some specific groups of respondents in these countries and that this process is not random in terms of factors taken into account in sampling procedure.
Extreme Values
We found that minimum values of weights range from exactly 0 (in 42 surveys) to 1.91 (Philippines, ISSP, 1991). The lowest maximum value of weights, 0.92, was found in the New Baltic Barometer survey in Lithuania, 2001. The highest, 90.32, in New Zealand, ISSP 2007. The issue of cases multiplied by weighting is very similar in its effects to the problem of outliers (Benmei 2004), even though the source in the former case is artificial. One of the potential solutions to the problem of high values of the maximum and minimum in calculated weights is trimming extreme weights (Biemer 2010; Little et al. 1997).
Conclusion
Weights can also be used to evaluate the quality of survey data. For example, excluding cases by assigning zero weights suggests errors in weight computation or deficiencies in the documentation provided by the authors of the studies. Errors related to weights should be analysed together with other types of errors, especially if they are to be used as a source of meta-data information about the overall survey quality. It is important to keep in mind that correcting formal errors in weights, e.g. re-scaling weights whose mean differs from 1 back to the original sample size, improves the quality of weights in the technical sense, but does not ensure that the weights have been calculated properly, or that using them as correction factors improves the representativeness of the sample.
This work is funded by the project conducted by the Institute of Philosophy and Sociology of the Polish Academy of Sciences and the Mershon Center for International Security Studies at The Ohio State University, USA with funding from the National Science Centre, Poland (grant number 2012/06/M/HS6/00322).
Marta Kołczyńska is a Ph.D. candidate at the Department of Sociology, The Ohio State University, and a research assistant in the Harmonization Project.
Marcin W. Zieliński, Ph.D., works in the Robert B. Zajonc Institute for Social Studies at the University of Warsaw on the Polish General Social Survey and the Polish edition of the International Social Survey Programme. He is also the head of the Polish Social Data Archive (ADS).
Przemek Powałko currently works as a database specialist for the Data Harmonization Project at the Institute of Philosophy and Sociology, Polish Academy of Sciences.