Welcome to the Writer's Toolkit MSc project, created by Robert Ang,
under the supervision of Jon Oberlander, Micha Elsner and Victoria
Adams at the University of Edinburgh.
The current project, the emotion graph generator, is currently in its
second version. Built with Mohammad Saif's crowdsourced emotional
lexicon, the tool analyses texts with a focus on either emotional
words, or narrative point of view (with respect to first, second and
third person). The line graphs generated by this tool are interactive,
directing users to emotional words in their text with the click of a
button. With your testing and feedback to the survey found here,
we'll be able to assess how well the tool functions to help writers in
the writing and editing process. (Please submit surveys by 11/8/12)
All texts input to the emotion graph generator will not be stored or viewed by any parties.
(NOTE: Unfortunately, the emotion graph generator does not function in
Internet Explorer. Download a separate browser, such as Mozilla
Firefox, Google Chrome, or Safari, to run the tool. The author of this
tool wrote and tested it on Firefox.)
Instructions
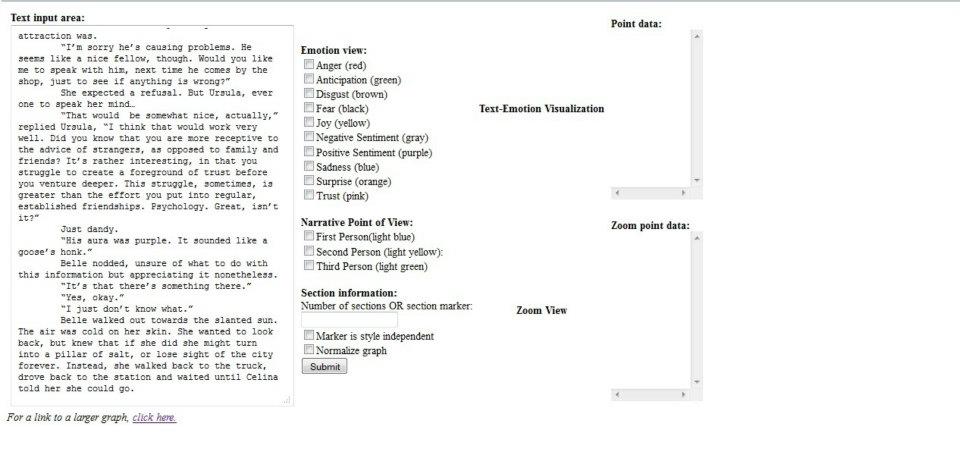
The emotion graph generator takes input texts in the input text box,
and partitions the text into sections determined by the user. A loop is
run over each section to see how many words in each section correspond
to a word in the emotion lexicon, or to a list of words corresponding
to first, second or third person. The data collected over these
sections is displayed as an interactive line graph showing the overall
trajectory of the text.
(For a tutorial video, please click here)
1. Place text into the input text box and select the emotions you'd like to view.
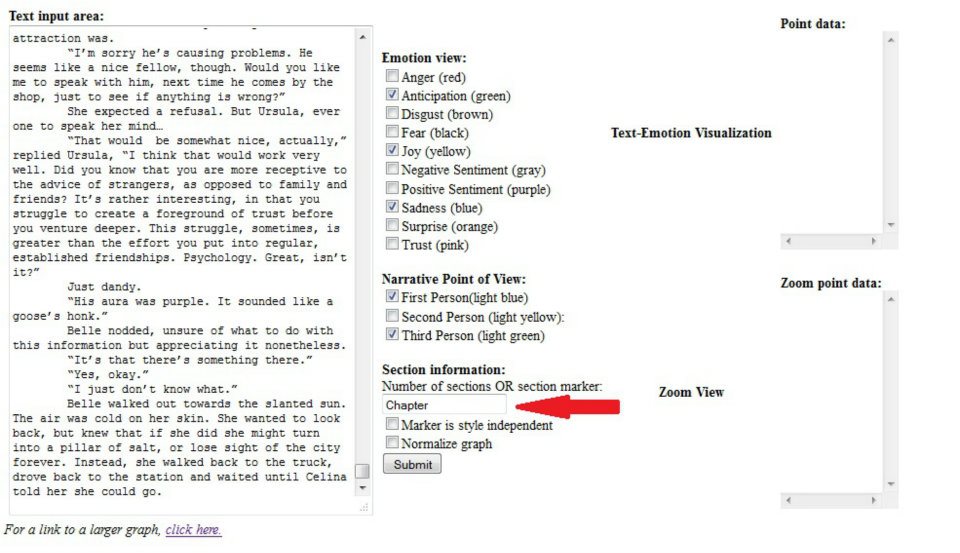
2. Create a section marker and place it in the section marker box (red
arrow). A section marker can either be a number of sections (say, "8"
for 8 equal length text sections), or a word (such as "Chapter," or
"blue," or "pizza" to make each dot correspond to whenever the that
word appears). Push submit, and a graph will appear!
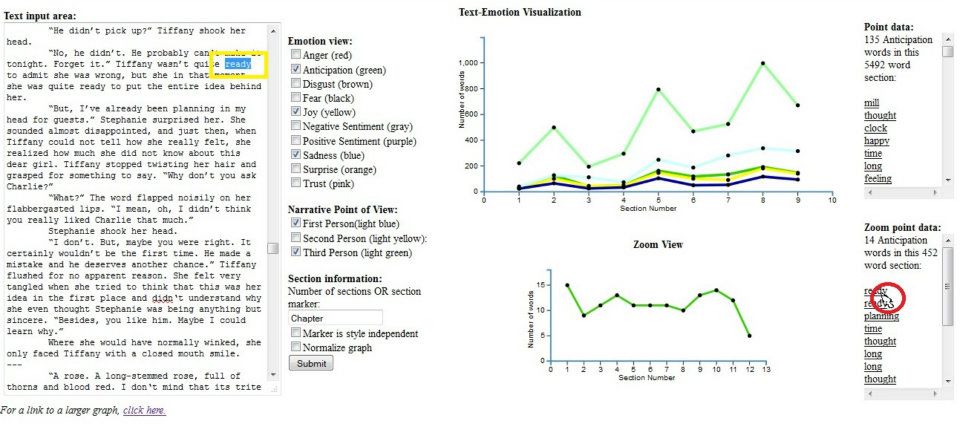
3. Click on dots on the graph to open up more interactive features.
Relevant sections of text will be highlighted (left yellow box), a
zoomed section graph will appear (center yellow box), and point data
with specific emotional words will appear (right yellow box).
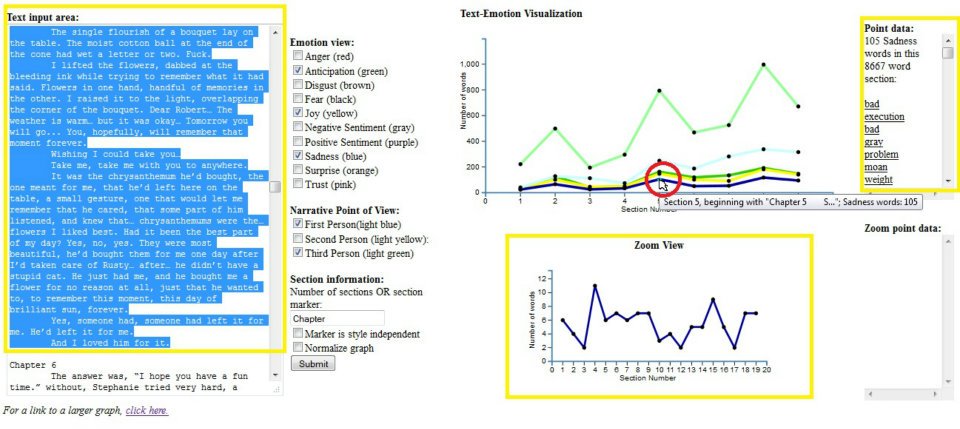
4. Clicking on a dot on the zoomed graph will highlight a 500 word
subsection of the main section (left yellow box), and create a list of
processed words (right yellow box).
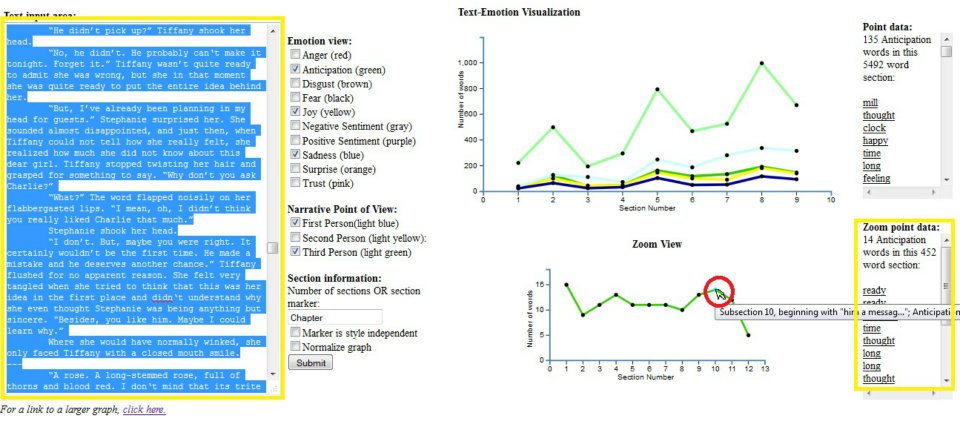
5. Clicking on a word in the point data or zoom data boxes will highlight the location of the word in the text.
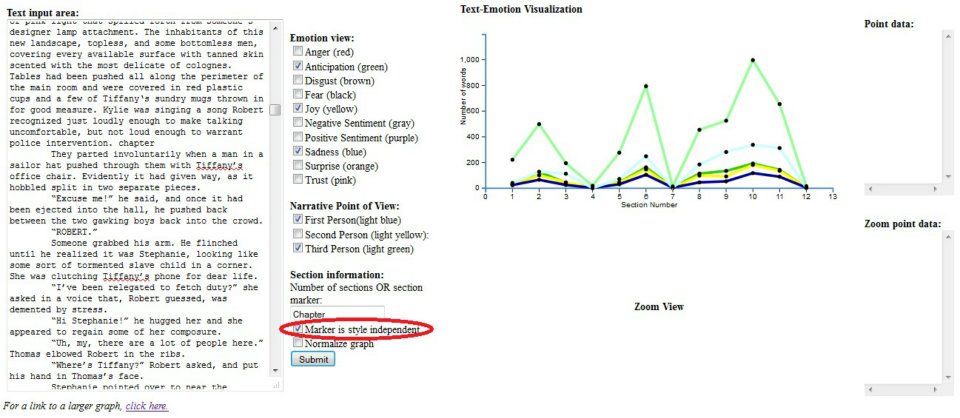
Note 1: Checking "Marker is style independent" will create a new
section whenever any form of the word is found (e.g. if "Chapter" is
made the section marker, and "marker is style independent" is ticked,
"chapter," "CHAPTER!!" "chaPter?" will all generate new sections).
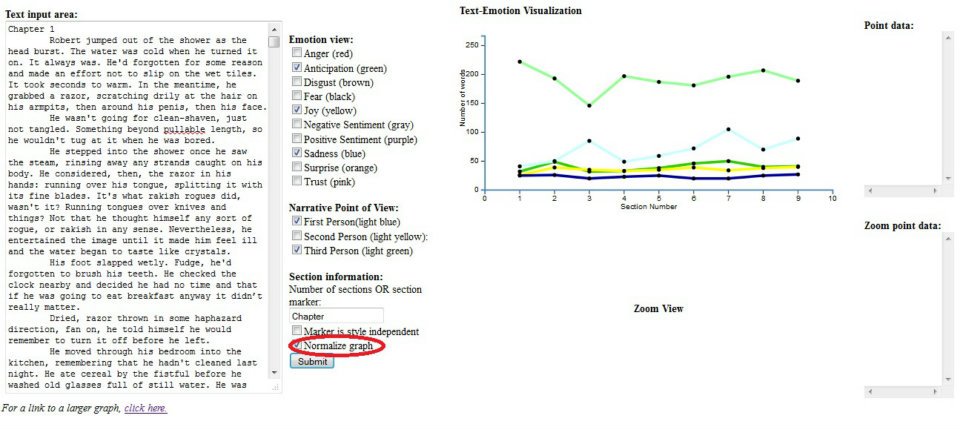
Note 2: Checking "Normalize graph" will normalize the emotional
readings across sections based on word count, if sections are of
unequal length (e.g. if there's an 8000 word chapter, and a 1000 word
chapter, it may look like there's an emotional peak at the 8000 word
chapter when in reality there are just more words in the section).
Thank you for your time. Without further ado, please click this link to proceed to the emotion graph generator.