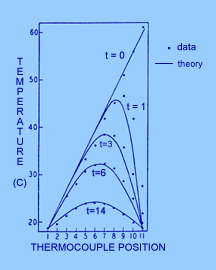

     Typical data for experiment H 03.  Temperature
     distribution along the copper rod for various
     times t (in minutes) after application of a
     temperature step function to one end.
A solid metal bar is placed in an insulated box. Boundary conditions are
imposed at the ends of the bar by pipes that run hot or cold water into
the box. Ten thermocouples are soldered to the bar so you can plot the
temperature distribution as a function of time. Compare your results
to the solution of the heat equation,

for the boundary conditions you choose.
Optional: Interface the thermocouples to a computer running LabView for automated data acquisition.
     Figure adapted from Shaw & Saunders,
     American Journal of Physics, Vol 23, No. 2,
     p 89-90, 1955.
![]()