Data Art
The goal for this project is to enable the Translational Data Analytics Institute (TDAI) and Pomerene Hall to be filled with data art: images, video, objects, and visualizations — both physical and virtual.
Locating data art and visualization work throughout our building provides opportunities for students, staff, and faculty to discover and consider the multitude of projects and research being conducted by members of TDAI’s growing community.
During the 2021-2022 academic year, a 3D design graduate student research position (GRA) was funded by a grant from TDAI to help create, develop, and test possible assets, experiences, and interactions for placing and viewing data-based artwork in Pomerene Hall, using augmented reality (AR).
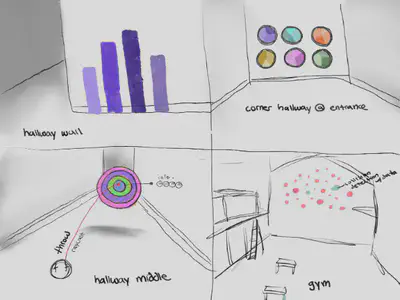
The first semester of work focused on investigating the space of practical possibilities. We attempted to identify diverse locations, data, and visualizations, as well as determine the pros and cons of different technologies. Sketches, images, videos, and 3D models of alternative were generated: early experiment portfolio
The software that was selected for these investigations was primarily free, inexpensive, and/or open source platforms. A primary goal was choosing technologies that would be more accessible for students and researchers. This included experiments with Sketchfab, Adobe Aero, model-viewer, A-Frame, three.js, p5.js, and Glitch.
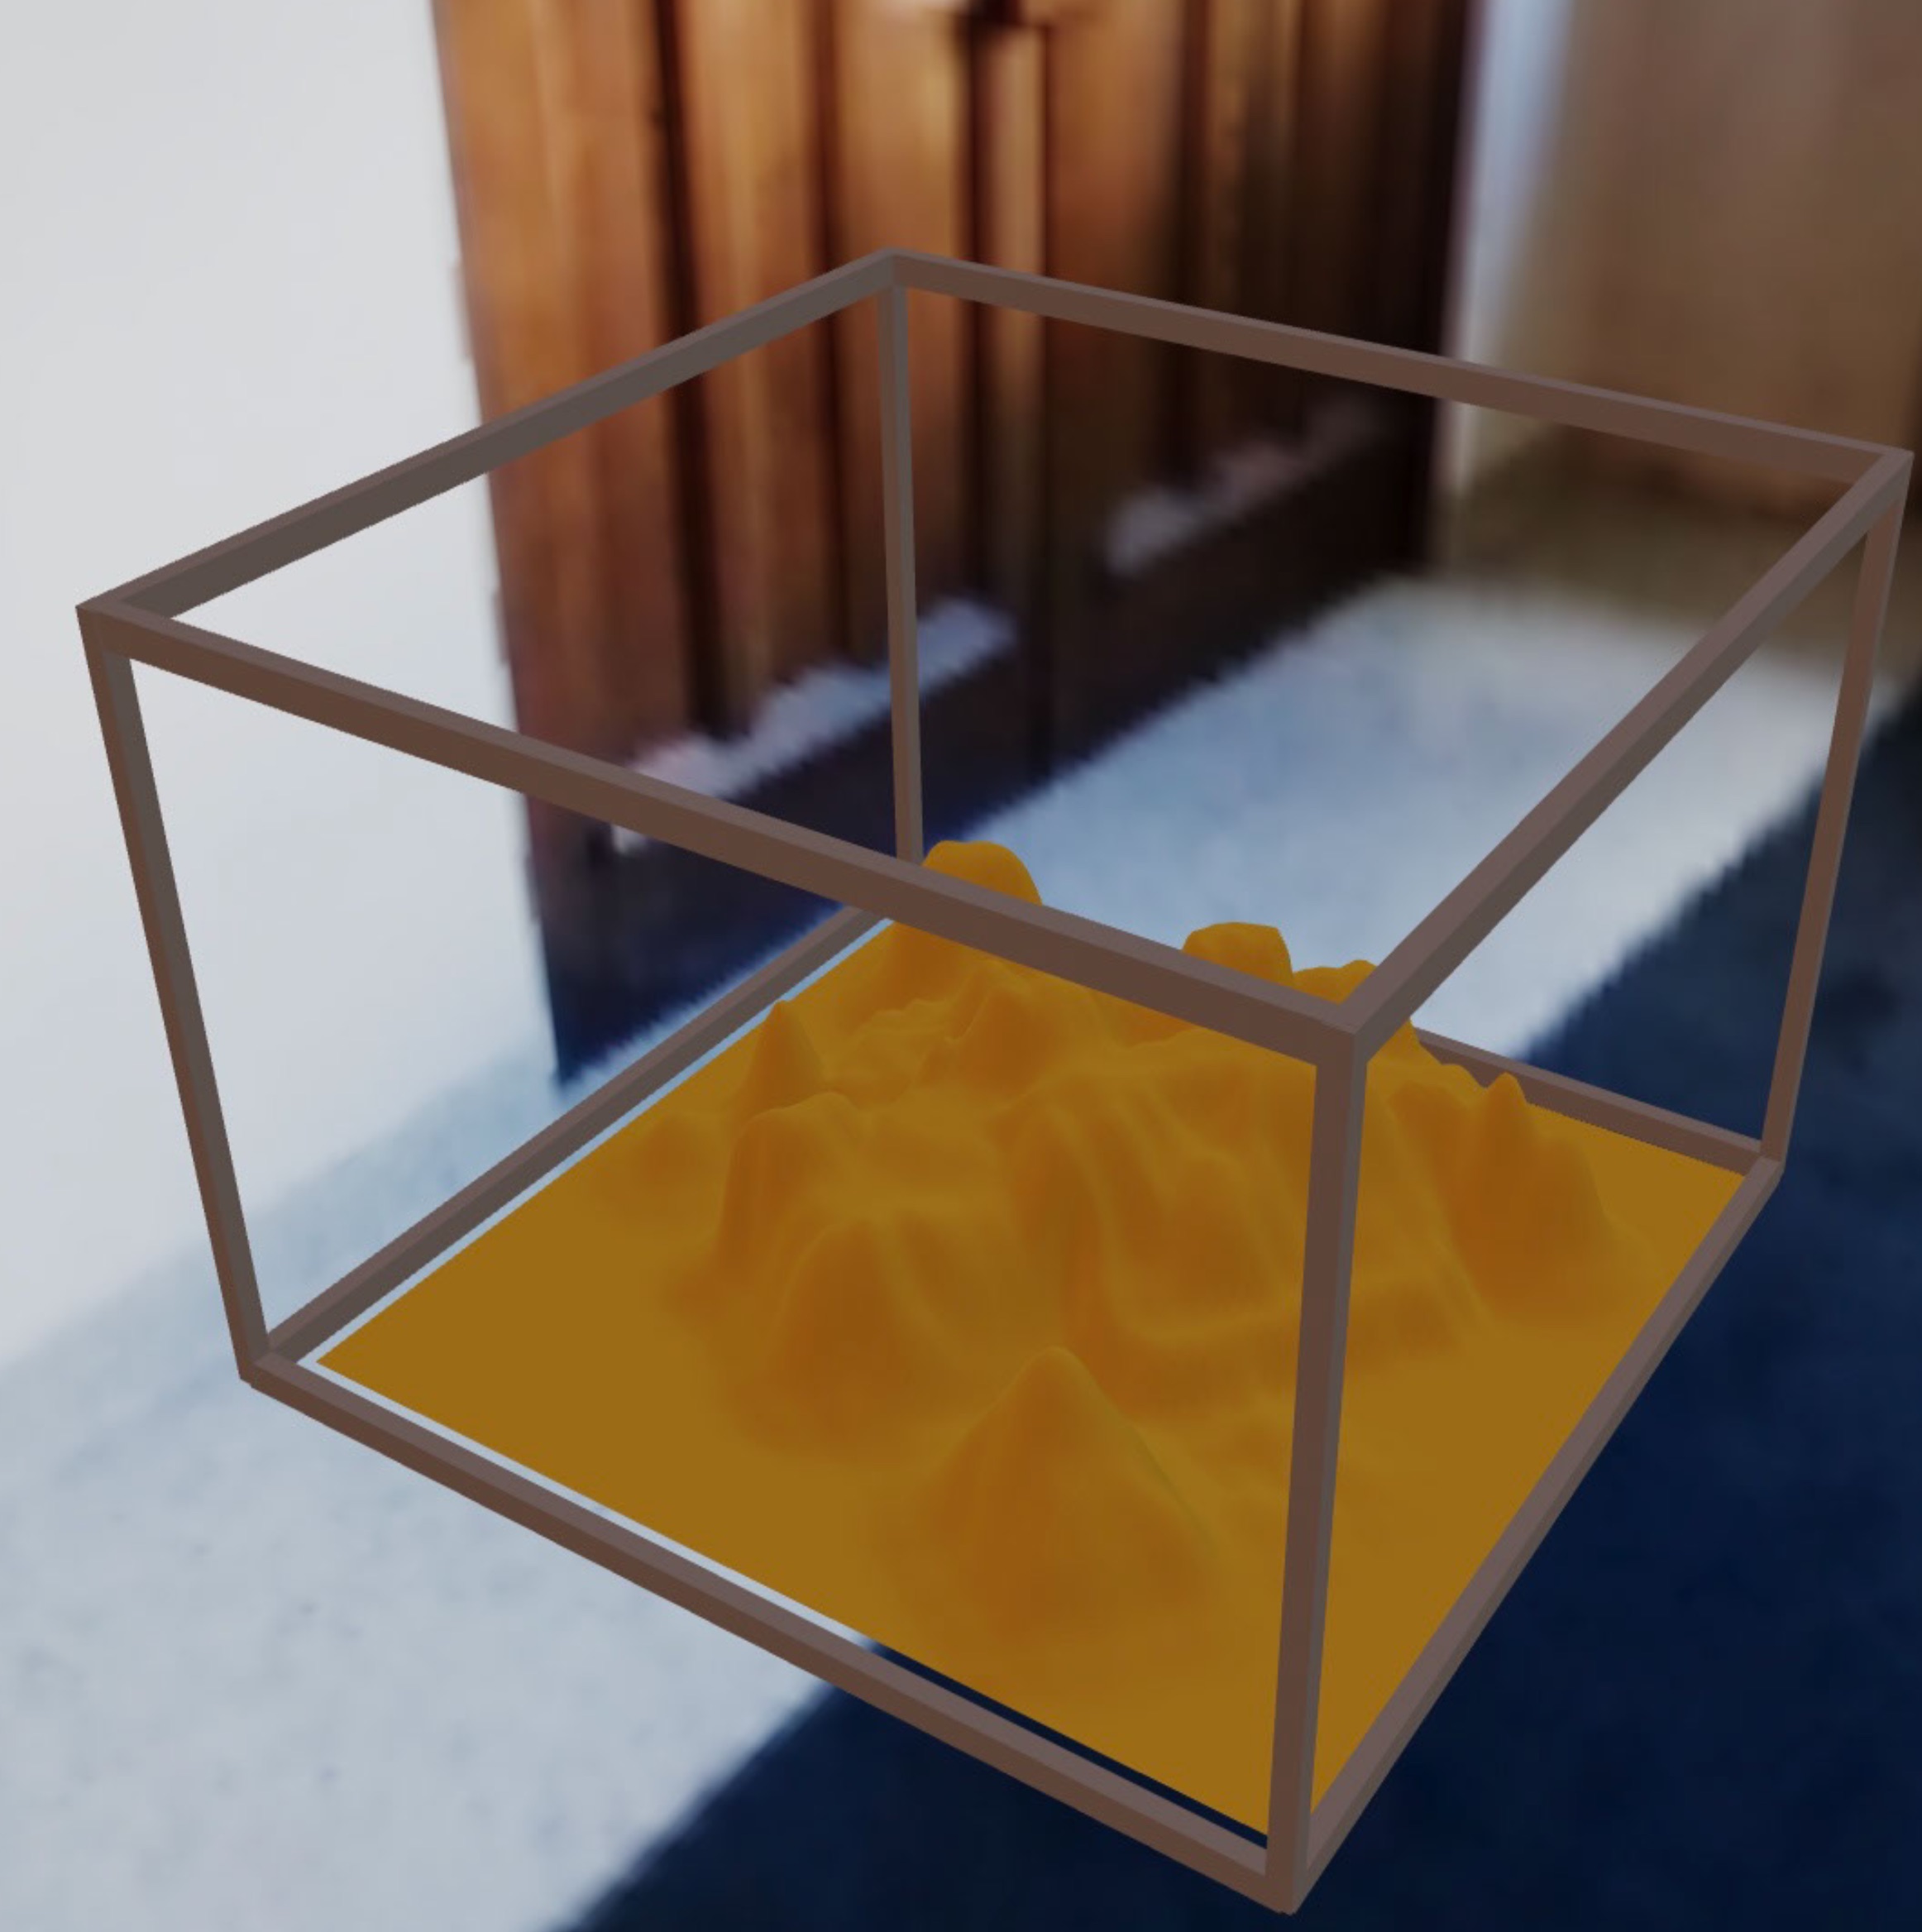
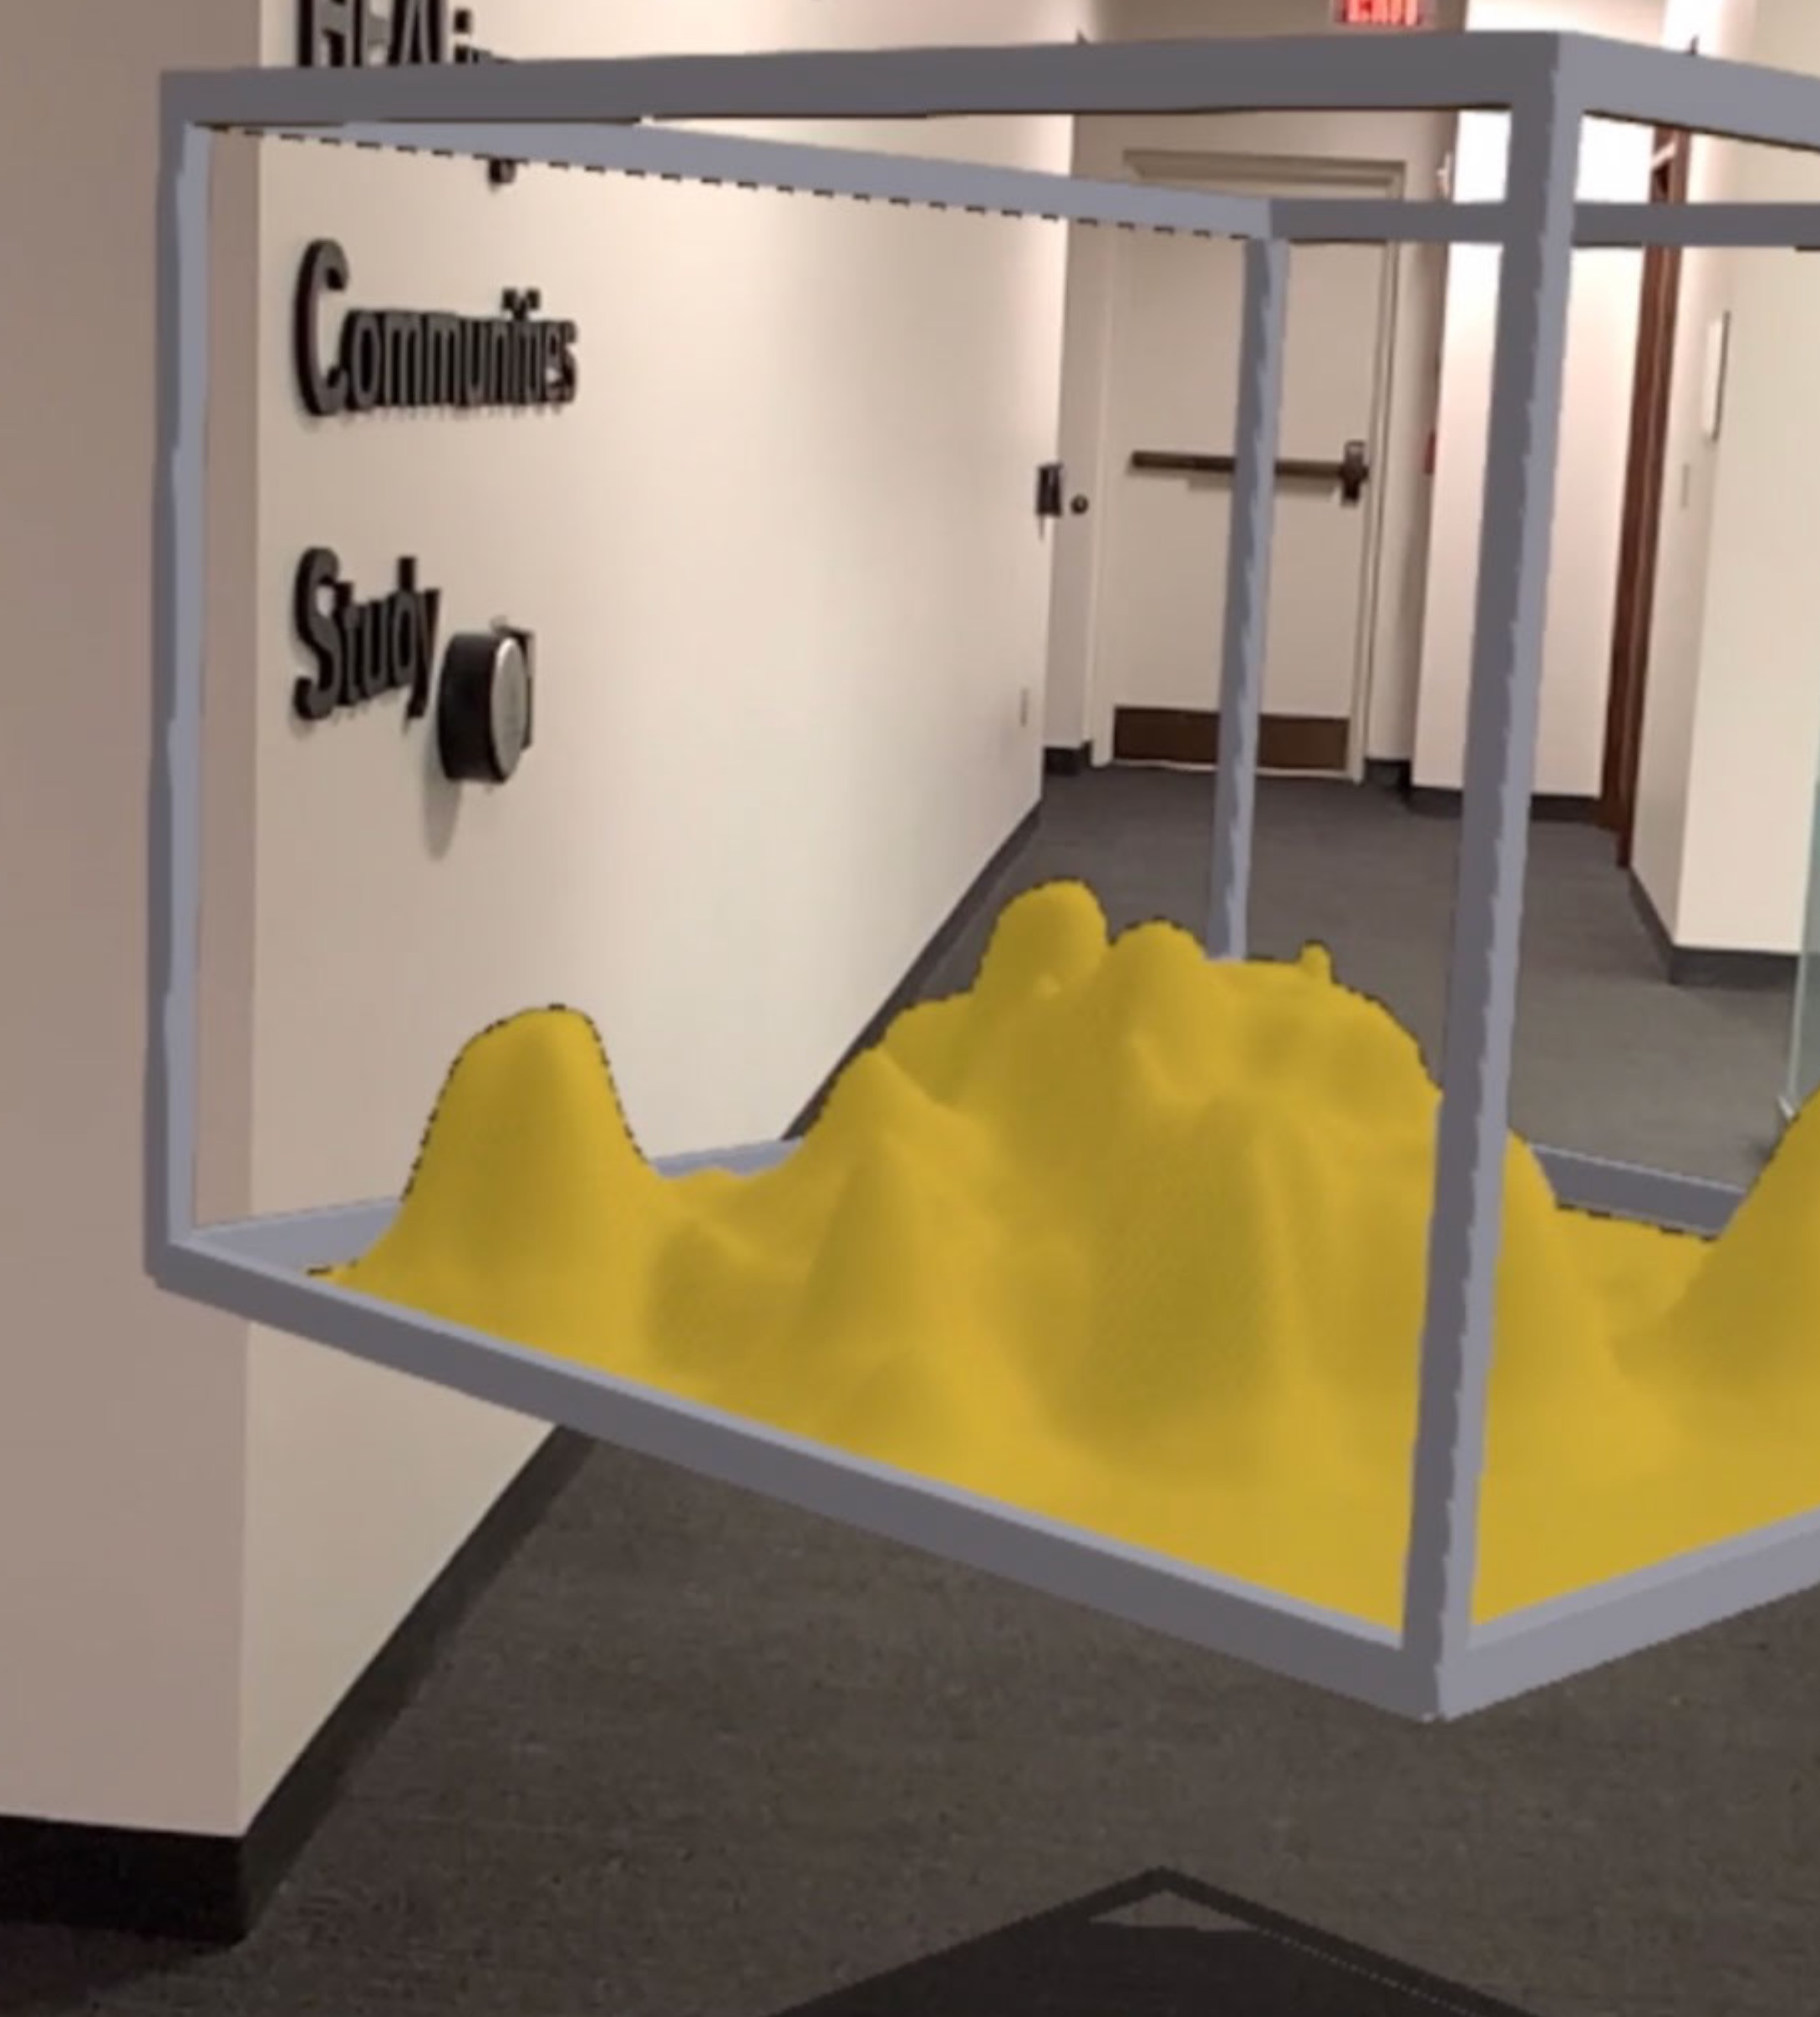
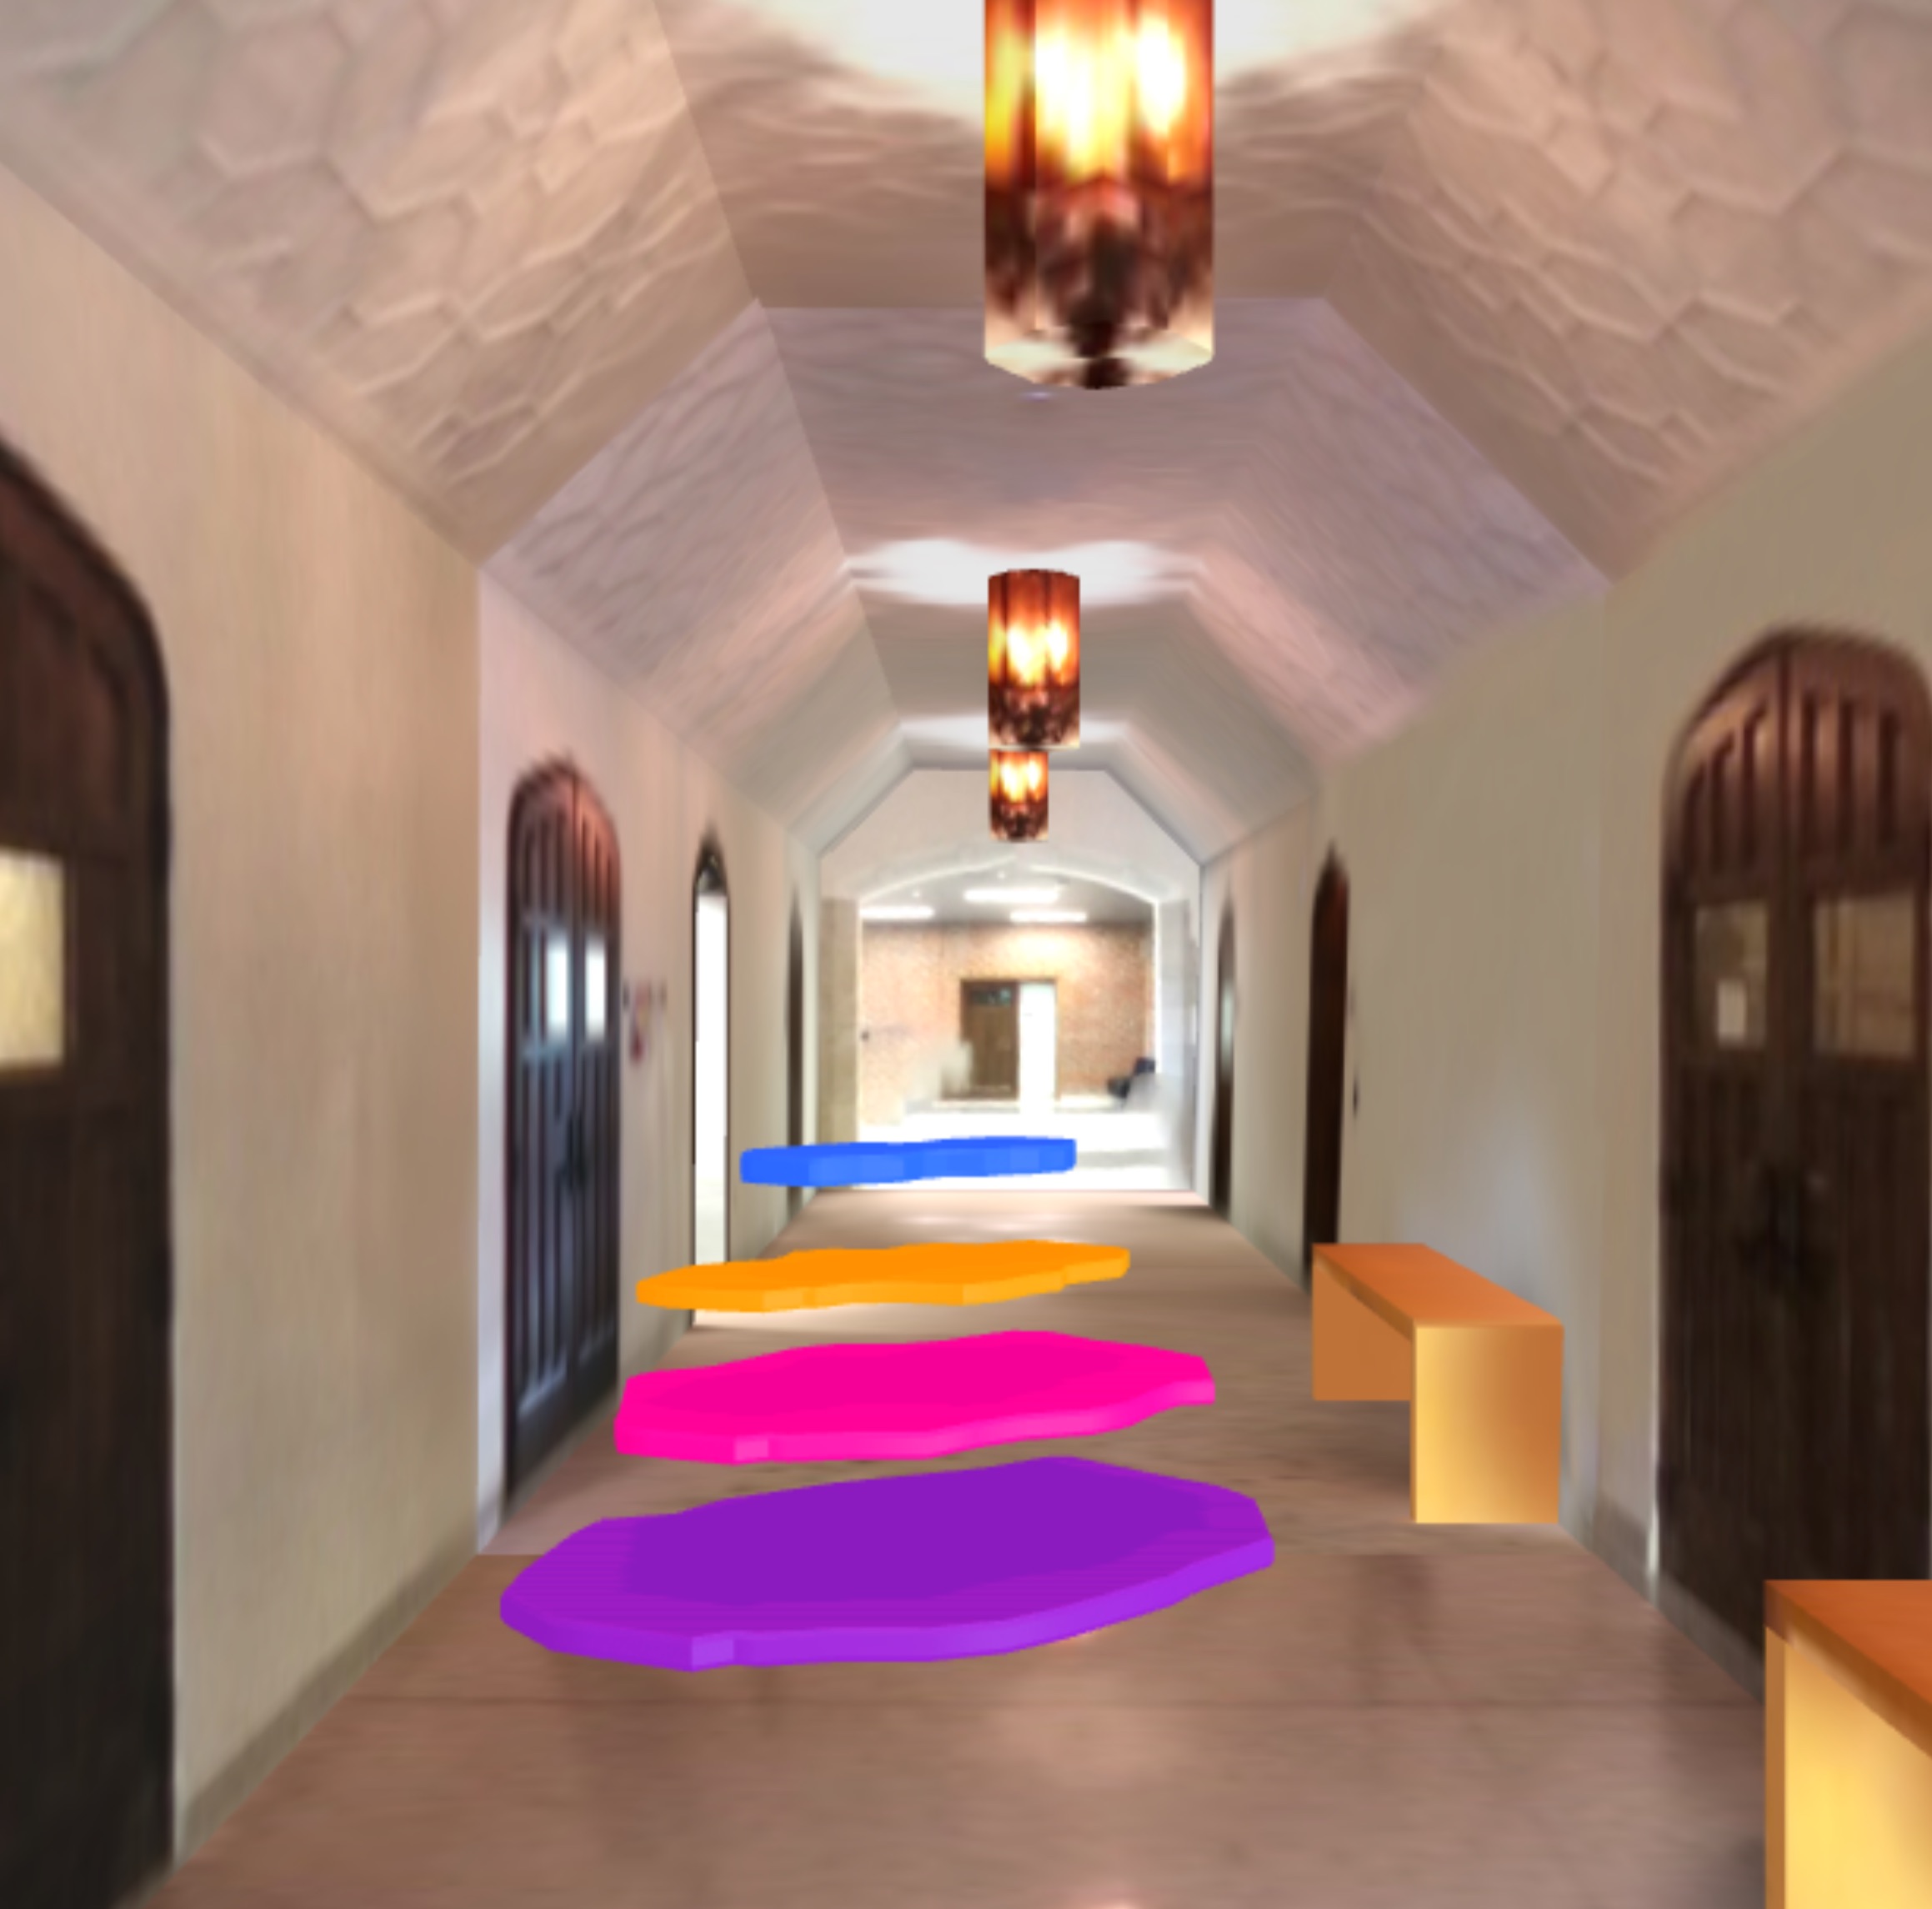
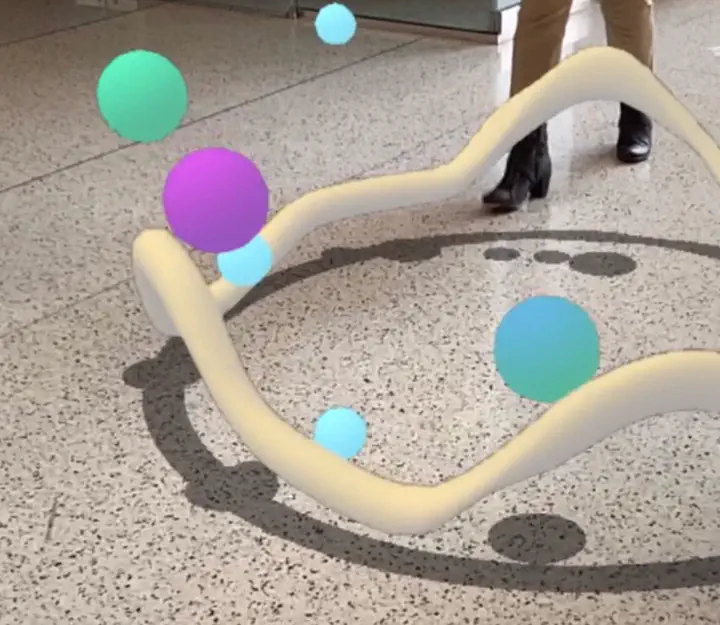
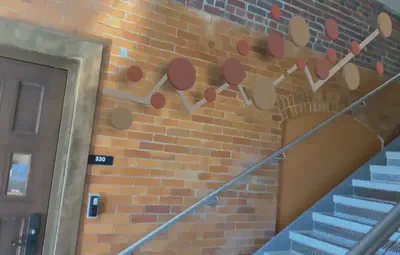
In addition to placing static geometric data objects in space, initial AR visual experiments included investigations of properties such as transparency, animation, materials, lighting, and shadows.
During the same year, ACCAD provided me with a programming GRA’s time for a complementary data research project: exploring the future of digital humanities visualization. I intersected these two efforts: using digital humanities data as our primary data source material for XR prototyping.
Wikidata, the structured data storage side of Wikipedia, was used as an accessible and vast source of humanities data. Documentation was created to show how to query data from Wikidata as CSV or JSON files that can then be used in visualizations.
See the digital humanities project for more examples of different types of data that was used by the design and programming GRA students for prototyping.
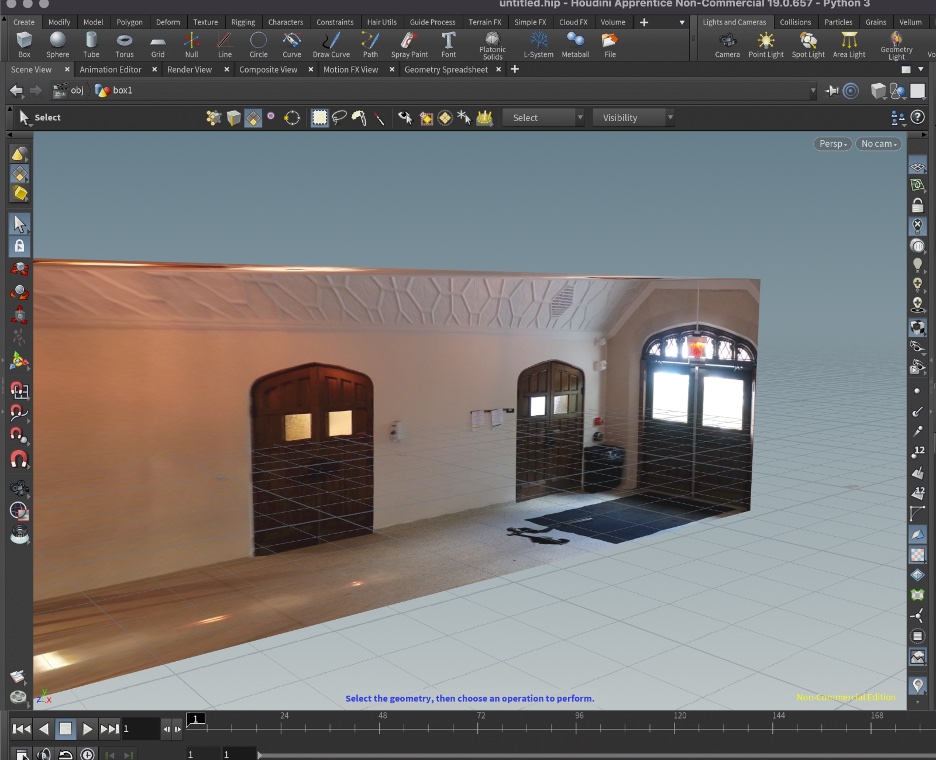
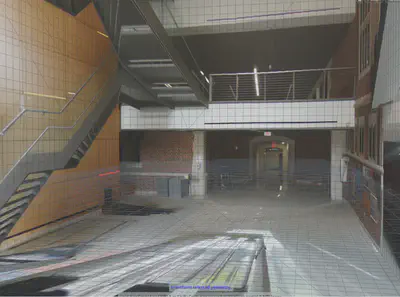
In addition to learning about accessible web-based AR technologies, we’ve been developing an approach for using VR as a means of remote design of located technology system experiences. This involves building a virtual version of a space, so it can be remotely used for experience design, rather than needing to always physically travel to the space (valuable during pandemic conditions and also promoting the sustainability benefits of reducing routine commuting.) See Virtual Spaces from 360° photos.
Simulating technologies in VR and AR
Using both VR and AR allows for the evaluation of proposed location-specific interventions (e.g., size, position, orientation, content, etc) before committing to physical installations. Specifically, we’ve started creating virtual versions of technologies such as monitors and mobile devices.
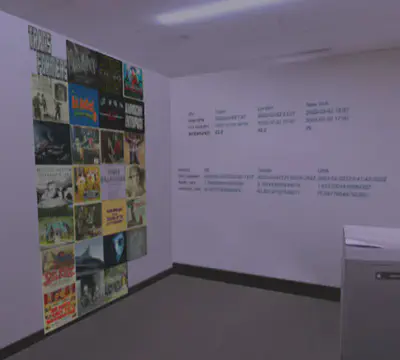
Virtual monitors can be placed on walls and tables are are smart about using a base if placed on a table but not when hung on a wall. Video files can be played on these monitors to see how date would appear in a physical space.
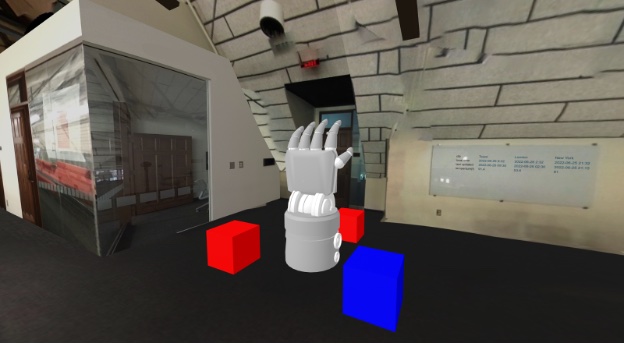
We’ve also investigating simulating a hand held device running AR, in VR. This means that while in a VR space, virtual (virtual) data objects can only be seen when looking at the mobile device screen. This should be very useful for developing AR experiences for remote locations.
After better understanding technical possibilities and designing a number of demonstrations, the reminder of the year was spent prototyping and documenting specific located experiences in the building. A 3D mobile web site was prototyped as a practical approach for locating experiences in the building. See: Mobile AR map prototype
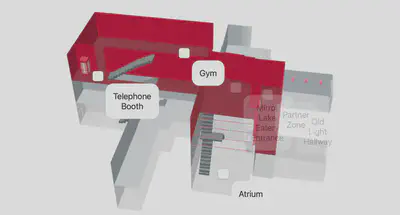
While indoor localization, 3D space recognition, and persistent object placement will eventually become more accessible, even then visitors will likely require a map to indicate points of interest in the building. Our current prototype shows spaces to go to, then lets the visitor place the AR object themself when they reach the desired location.
The XR knowledge acquired from this effort, combined with information about VR and AR from the digital humanities futures and AR trees projects, is being collected on a web page and shared. We’ve listing techniques and solutions for many problems encountered, as well as links for getting started. See visualizing data with web-based XR
Graduate Students:
- Emily Subr (Design): 2D, 3D, XR and web production and design
- Hsi-Yuan Chu (Design): programming, XR prototyping
Project support:
- Emily Subr’s GRA support funded by the Translational Data Analytics Institute (TDAI)
- Hsi-Yuan Chu’s GRA time was provided by ACCAD
Additional images: