Probabilities from the waveform
We have considered a waveform with two well-separated bumps; further the bumps were taken to be equal in strength. In this situation it was natural to expect that the electron will have a probability \( 50\%\) of being at one bump or the other.
But of course the wave will not in general have two well separated equal bumps. How should we use the waveform to find the probabilities of finding the electron in different places?
We will start with simple examples and work towards the general case.
Multiple bumps
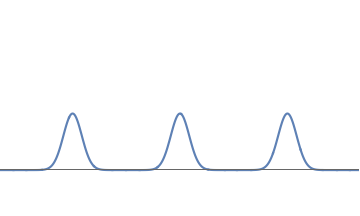
Consider an electron wave with three well separated bumps, each equal in strength. In this case the electron has a probability \( 1/3 \) (i.e., \( 33.3 \%\)) of being localized near any one of the bumps.
More generally, we can make the waveform such that the electron has a probability in any one of \( n\) different places, for any number \( n \).
Unequal bumps
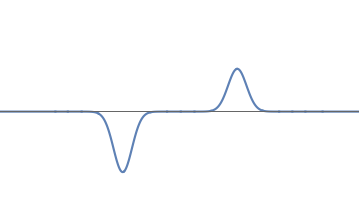
We can have a waveform which is negative in some places, and positive in others. Further, the amplitude of the wave can be different at different bumps. To find the probabilities in this case we proceed as follows:
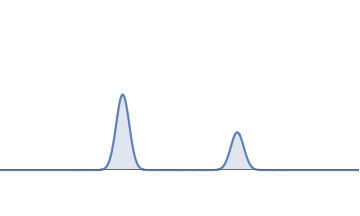
- First we square the wavefunction to get a function that is positive everywhere.
- The total area under this squared graph is \( 1 \); this follows from the discreteness condition of the wave. Suppose the left bump has area \( 2/3\) and the right bump has area \( 1/3 \). Then the probability is \( 2/3 \) that the electron is near the left bump and \( 1/3 \) that it is near the right bump.
A general wavefunction
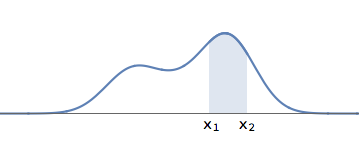
A general wavefunction need not have well separated bumps. But we can ask the question: what is the probability that the electron lies in the interval between \( x_1\) and \( x_2\) ? We proceed as above:
- We first square the wavefunction, to get a graph that is positive everywhere.
- The total area under this squared graph is \( 1\). We find the area under this graph in the interval between \( x_1\) and \( x_2\). Suppose this area is \( 0.2\). Then the probability is \( 0.2 \) (i.e., \( 20\%\) ) that the electron is in the region between \( x_1\) and \( x_2 \).
We have noted that the wavefunction is often called \( \psi(x)\). We had also denoted the square of the wavefunction by \( P(x)\). We can now see the reason for the latter symbol. The letter \( P \) stands for 'probability'. We see that the area under the \( P(x)\) graph gives the probability for the electron to be in different regions of the \( x \) axis.
The next step
We have now seen how the shape of the waveform tells us the probabilities of finding the electron in different places. We now have the tools to address a crucial question: how should we understand the process of measurement?

A waveform with three equal bumps.

A waveform with unequal bumps.

Squaring the above waveform gives the probability graph for that waveform. The area under the left bump is \( 2/3 \) and the area under the right bump is \( 1/3 \).

A general waveform for the electron. The probability for the electron to be in the region between \( x_1\) and \( x_2\) is given by the shaded area.