Supplementary Data File as used by JHM
(.TXT format, tab delimited.
If the columns appear misaligned, try opening the file with a different program.)
Supporting data sets as posted on PNAS website
If these files don't appear correctly on your browser, try right-clicking the link, saving the file to your computer,
and then opening it directly from your computer.
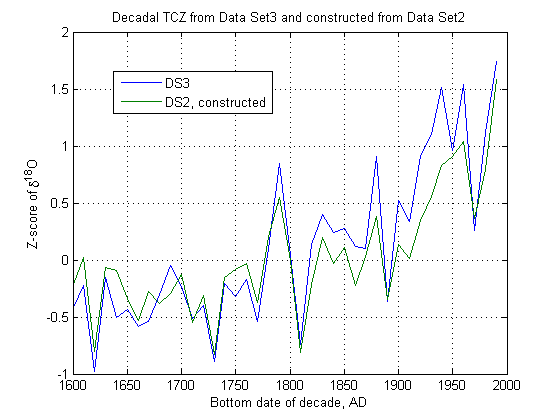
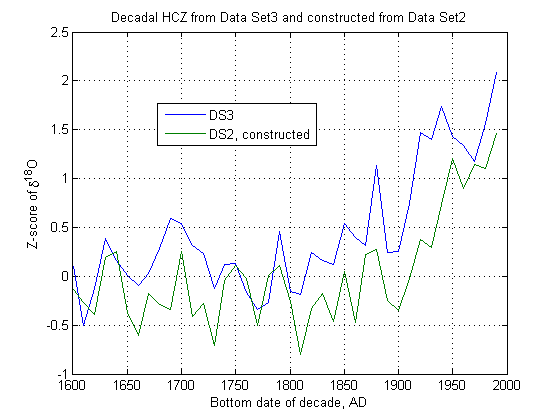
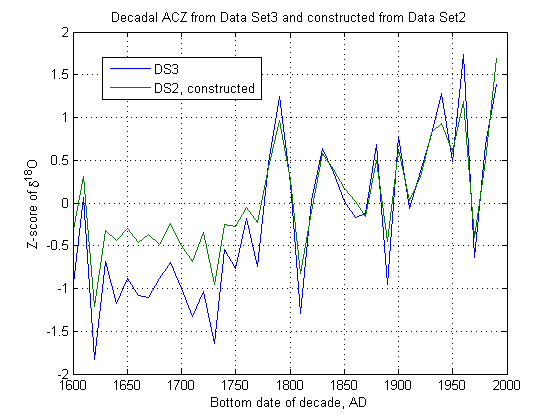
It turns out that the root of the problem is that the decadal average Z-scores shown in Thompson's Figure 6 and my Figure 1 above, and tabulated back to year 0 in Data Set 3, are not the decadal averages of the 5-year average Z-scores shown back to 1600 in Thompson et al.'s Figure 5 and in their Data Set 2:
The problem is not isolated to the data for just one region, since the two regional indices have the same problem:
However, the problem cannot just be that Figure 6 was computed from the same data but using standard errors for the 2000-year period instead of the 400-year period of Figure 5, since then there would still be an exact (though different) linear relation between the Figure 6 composites and decadal averages of the Figure 5 core data. As I show in my EE paper, no such linear relation exists.
So the problem still persists — which is the right data to use to construct an ice core temperature proxy? The data of Figure 5 (which although it only goes back to 1600 AD is at least identified by core number in DS2), or the (unspecified) data used to construct Figure 6?
Since Figure 5 is not representative of the data that was used to construct Figure 6, Thompson and co-authors have failed to provide, as required by the PNAS data policy, sufficient data to replicate his results. At a minimum they should identify the archived cores that were used to construct Figure 6, and provide detailed data for any unarchived cores that were used.