
Data Science: Earth Day


Climate change is a problem affecting the whole world, and it is one of the most pressing issues today. Scientists estimate that the average global temperature has increased by about 1.4 degrees Fahrenheit. This may not seem like a big change, but we will see how this shift affects the number of freezing days (< 32 °F) each year.
We are going to estimate the impact of global warming at your location using a simple cosine function and some climate data.
Today we will:
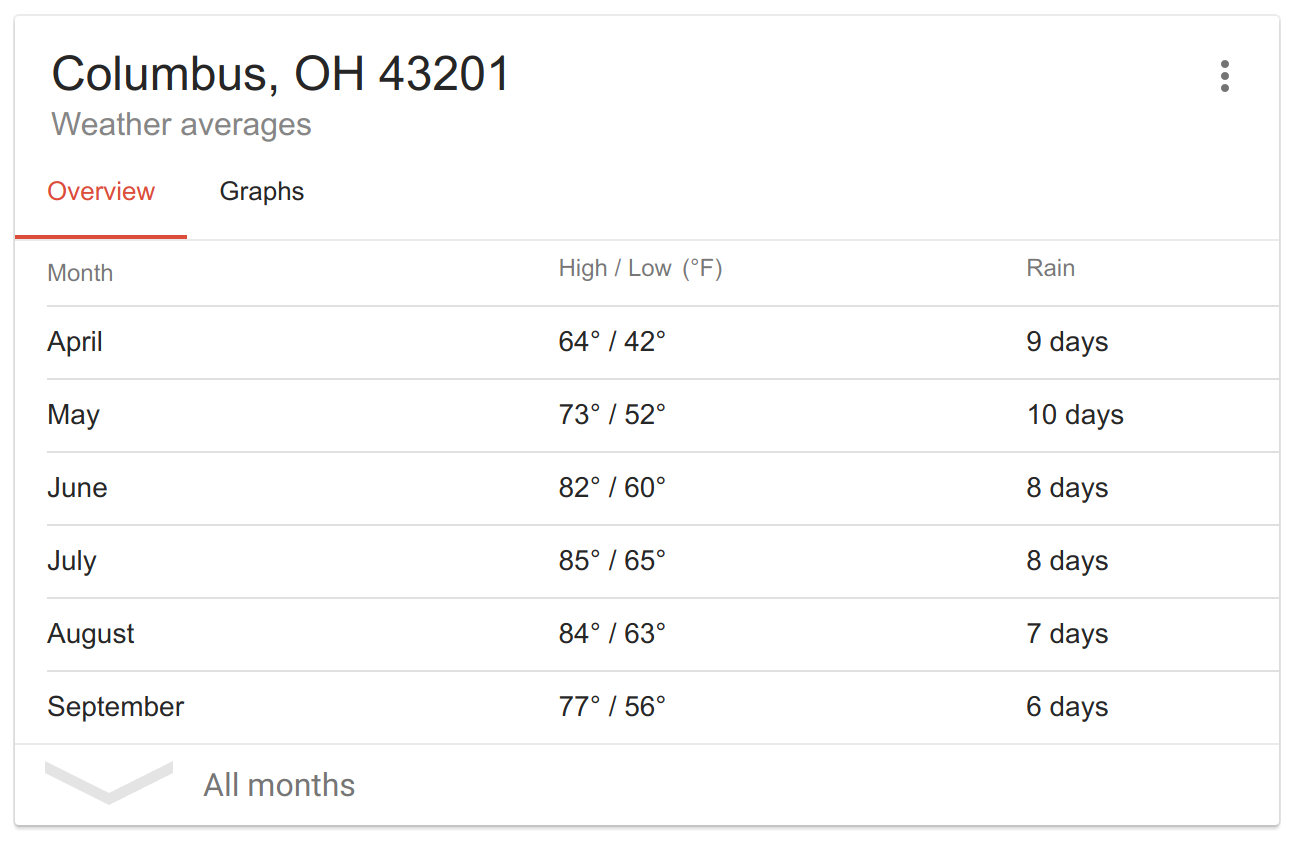
To look up the typical high and low temperatures throughout the year for your location, go to Google and type "climate data [name of your city]" into the search bar. This will automatically give you climate data for your location.
The data below is shown for Columbus, OH, but you should be able to easily adapt this for your location by following the directions and modifying the program.
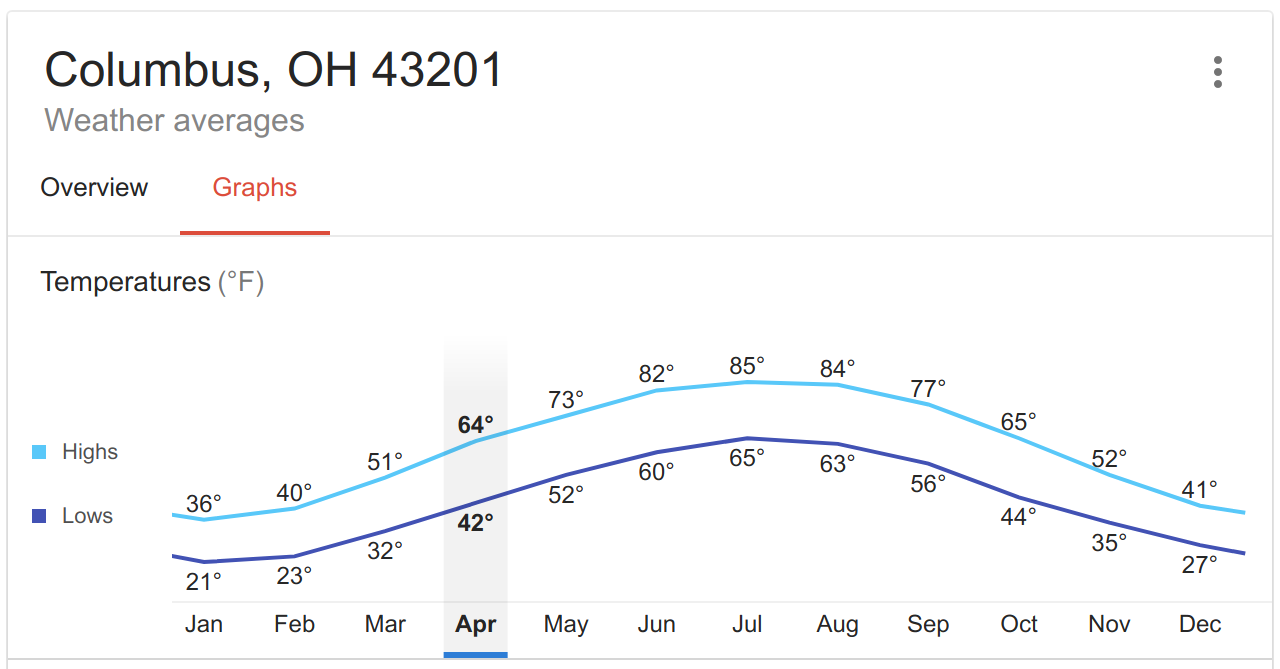
Click "Graphs" to see how the high & low temperature varies throughout the year
If you were curious where this data comes from, Google obtained it through the NOAA website.
We need to estimate the average temperature during the coldest month and warmest month of the year. The easiest way to do this is to take an average of the high & low temperature in January and July. In the following we will use the numbers for Columbus, but you should use the numbers for your location: $$ T_{\rm coldest} = \frac{T_{\rm jan, high} + T_{\rm jan, low}}{2} = \frac{36 ° F + 21 ° F \rm }{2} = 28.5 ° {\rm F} $$ $$ T_{\rm warmest} = \frac{T_{\rm july, high} + T_{\rm july, low}}{2} = \frac{85 ° F + 65 ° F \rm }{2} = 75.0 ° {\rm F} $$
Go ahead and calculate what these numbers would be for your location. The above is just an example.
Click here to open up the code in the editor (works best in chrome)
Here is a link if you just want to run the program
Go ahead and look at the code to see the different parts. Notice that each time we run the draw function, the global temperature increases by a small amount.
Advice: Near the bottom right portion of the code, you can click the arrow by "Clear" to minimize the console and see more code.
Optional: Save Your Work
If you want to save your work, create an account and confirm a password. Nobody will sent you e-mails to bug you if you do this.
Note: You do not need to create an account to complete the activity, but you will need to create an account to save your work.
Click "Sign Up" in the top right, and create an account with a password.
Now when you open up the code in the editor, you can click "File" in the top left and "Duplicate" to copy a version of the code to your account. To open it, click the menu in the top right and go to "My Sketches". After editing the code, you can save your progress by clicking "File" and "Save".
Modify lines 2 and 3 of the code to have the appropriate values for your location:
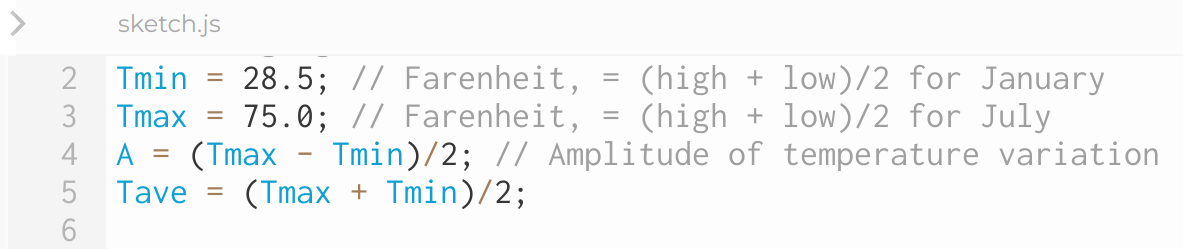
You should include the numbers you calculated in Step 2.
Run the code and notice how many freezing (T < 32 °F) days are lost per year as the temperature shift increases. You can pause and un-pause the code at any time by clicking anywhere on the graph.
The horizontal black line in the graph on the bottom right represents 10 days lost! Pay close attention to how many freezing days are lost when the temperature shift reaches 1.4 °F, which is the global average amount that the Earth has already warmed.
Our model for the temperature thus far looks like this: $$T(t) = -A \cos \left(\frac{2 \pi}{T} \cdot t \right) + T_{\rm ave} $$
In the code, this equation looks like this:
Temperature[i] = -A*cos(2*PI/Year*t) + Tave;
As we all know, the temperature can be very different from day to day. In the midwest, it is not uncommon for the temperature to swing up or down by as much as 10 degrees Fahrenheit from day to day. Let's add some variability to our model and see what the effect is on the number of days with freezing weather.
So take this code:
Temperature[i] = -A*cos(2*PI/Year*t) + Tave;
And add to it a random function:
Temperature[i] = -A*cos(2*PI/Year*t) + Tave + random(-10,10);
Now see what happens! Your code should behave something like this.
Watch the code run and confirm that you still lose a significant number of freezing days as the global temperature increases.
It would be interesting to download the temperature data for when the shift in temperature is equal to some value, such as 1.4 degrees Fahrenheit. This is the current estimate for the overall increase in average temperature due to manmade climate change (since about 1950).
You can do this by adding this code AFTER the "for loop" around line 41:
   if (Twarming.toFixed(2) ==  1.4) {
        saveData(table,'daily_temperatures.csv');
   } // end if
Unless you changed the location, this file can probably be found in a "Downloads" folder.
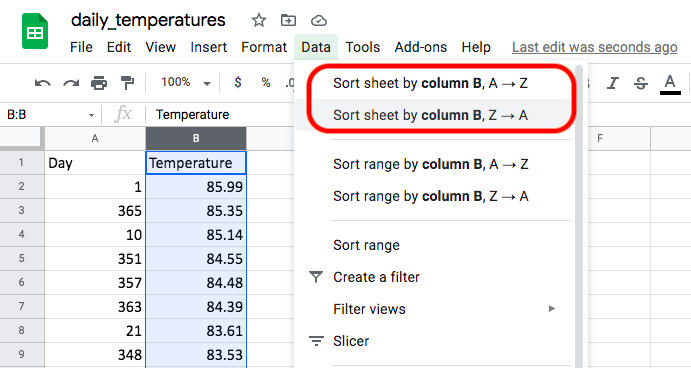
Open up the data in your favorite spreadsheet program (examples: Google Sheets, Excel, LibreOffice, Apple Numbers) and sort the temperatures from highest to lowest. For example, you can use the Sort options in Google Sheets like the following screenshot:
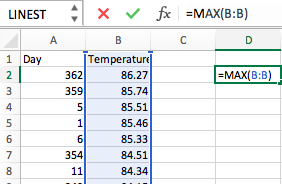
You can also use the "minimum" and "maximum" functions to find the hottest and coldest temperatures. In a new cell type =MAX() and select all the temperatures, like in the following screenshot:
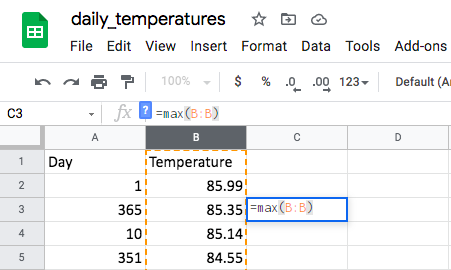
Repeat the same with =MIN() for the minimum. What are the hottest and the coldest temperatures of the year?
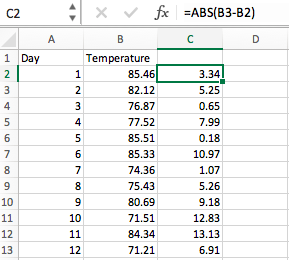
Sort the data in order by day again. Let's now look at the temperature jump from day to day. Look at the difference in temperature between days 1 and 2, then between 2 and 3, and so on. Subtract the lower temperature from the higher temperature to find each temperature difference. We can do this automatically by typing =abs(B2-B1) in C1 and dragging the blue box all the way down:
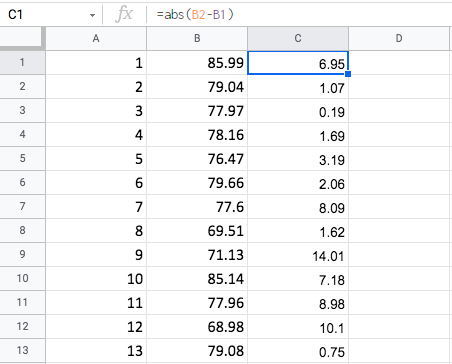
Note: When dragging code to multiple boxes, you may see a #VALUE! error pop up (maybe in the bottom box). This is because you are trying to add or subtract a box with letters in it instead of number data. Check the error box to see what is going on, and then either delete or ignore the error.
Remember that the random(-10,10) function would add a random number between -10 and +10. What should be the largest temperature swing from day to day?
In the code we just added, you can also change 1.4 to 0 and see how the hottest temperature has changed. Compare to real data from www.timeanddate.com/weather
It would be interesting to download the temperature data for when the shift in temperature is equal to some value, such as 1.4 degrees Fahrenheit. This is the current estimate for the overall increase in average temperature due to manmade climate change (since about 1950).
You can do this by adding this code AFTER the "for loop" around line 41:
   if (Twarming.toFixed(2) ==  1.4) {
        saveData(table,'daily_temperatures.csv');
   } // end if
Unless you changed the location, this file can probably be found in a "Downloads" folder.
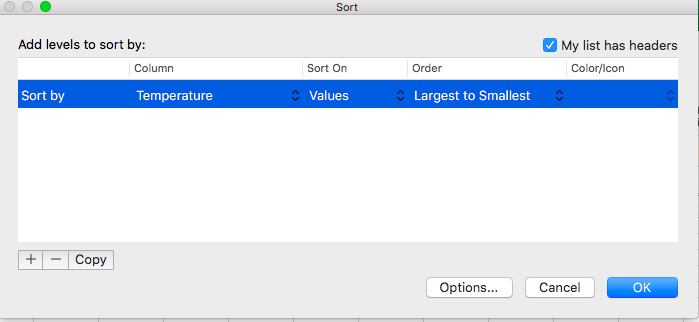
Open up the data in your favorite spreadsheet program (examples: Google Sheets, Excel, LibreOffice, Apple Numbers) and sort the temperatures from highest to lowest. For example, you can use the Sort option in Excel like the following screenshot:
You can also use the "minimum" and "maximum" functions to find the hottest and coldest temperatures. In a new cell type =MAX() and select all the temperatures, like in the following screenshot:
Repeat the same with =MIN() for the minimum. What are the hottest and the coldest temperatures of the year?
Sort the data in order by day again. Let's now look at the temperature jump from day to day. Look at the difference in temperature between days 1 and 2, then between 2 and 3, and so on. Subtract the lower temperature from the higher temperature to find each temperature difference. We can do this automatically by typing =abs(B2-B1) in C1 and dragging the green box all the way down:
Note: When dragging code to multiple boxes, you may see a #VALUE! error pop up (maybe in the bottom box). This is because you are trying to add or subtract a box with letters in it instead of number data. Check the error box to see what is going on, and then either delete or ignore the error.
Remember that the random(-10,10) function would add a random number between -10 and +10. What should be the largest temperature swing from day to day?
In the code we just added, you can also change 1.4 to 0 and see how the hottest temperature has changed. Compare to real data from www.timeanddate.com/weather
There are a number of ways that we can improve the model. Here are some ideas:
1. Compare to published estimates for the impact of climate change at your location
It's possible that scientists have already assessed the impact of climate change at your location. Here is a link to reports for over a dozen cities in the wider Great Lakes region
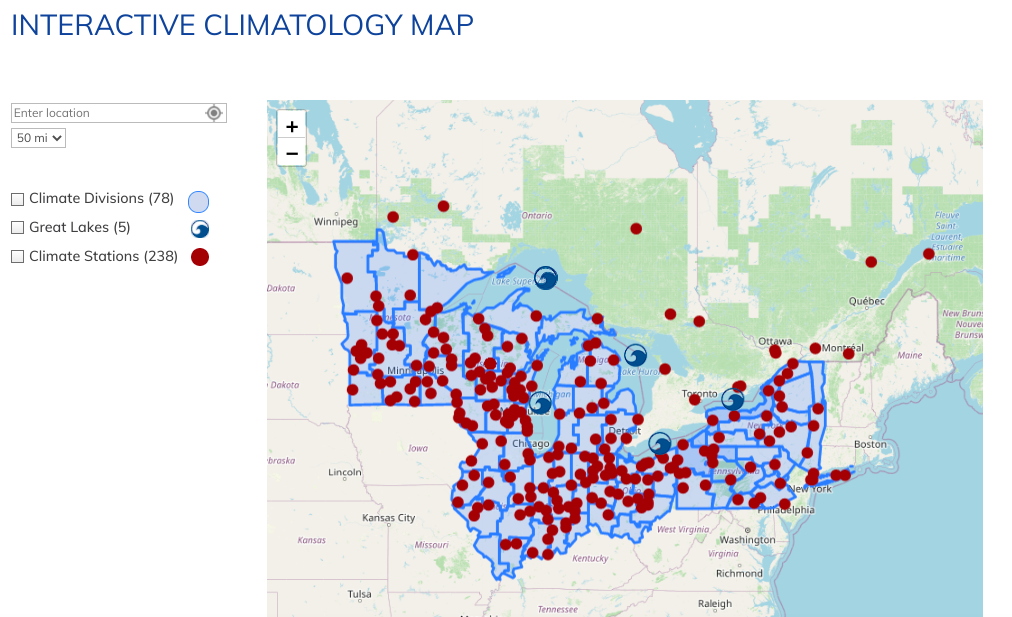
If you search for your city and click on one of the red dots, you can find documents like this one for Columbus, Ohio. Look for a table with "changes in average temperature."
Interestingly, some cities saw a temperature increase of more than 1.4 °F, and some saw less. Columbus actually saw an annual increase of 2.8 °F, and they estimate that there were about 33 fewer days of freezing weather as a result. How well does this match the estimate from the program with a temperature shift of 2.8 °F?
How many fewer days of freezing weather does the model predict for your location based on the temperature increase measured from 2017 (second hottest year on record)?
2. Do you live in a warmer area than Columbus? Not many days < 32 °F? Modify the code!
In warmer areas of the US, there may not be ANY days that have an average temperature below 32 °F. This does not mean that there is no impact of climate change. For example, according to this site mosquitoes are only active if the temperature is above 50 °F. For temperatures below that they go into a kind of hibernation for the winter. To check a different temperature besides 32 °F, we can define Tcheck in the code.
Add the following line near the beginning of the code to set Tcheck to 50 degrees and see what happens.
Tcheck = 50;
What is the impact of the increased temperature on the number of days that mosquitoes are active? How many more days of bug bites can you expect?
3. Consider a location close to the North or South pole, and consider the number of days of < 29 °F weather
Set Tcheck to 29 so that the program checks the number of days of < 29 °F weather, and choose a city near the North or South pole (for example: Barrow, Alaska). Originally we checked the number of days of < 32 °F weather because that was the temperature where fresh water turns into ice. In the previous challenge, we considered the number of days of < 50 °F weather because that affects mosquitoes.
Why would it be interesting to check the number of days that are < 29 degrees Fahrenheit? Hint: It has to do with ocean water.
4. Improve the model by making sure that the coldest day of the year is mid-January, rather than January 1st
If you look closely at the simulation, you will notice that it places the coldest day of the year at January 1st. If you do a search on your location at www.accuweather.com and you click "Month" and then select January, you will see that according to the historical average, the coldest day of the year is in mid-January, not the beginning of January. Can you modify the code to take this into account? (Hint: This is just a shift in the time variable).
5. Modify the code to simulate a city in the Southern hemisphere
When it is winter in the Northern hemisphere, it is summer in the Southern hemisphere. (If you don't believe it, go to a grocery store in the middle of January and think about how the bananas got there.) Do another Google search with "climate data [name of city]" but use a city in the Southern hemisphere (examples: Sydney, Australia or Cape Town, South Africa).
Step 1. Put in those numbers for the temperature into the code.
Step 2. Modify the code so that the coldest parts of the year are in July instead of January.
Hint: You only need to modify one line of code to do this.
6. Look closely at weather data for your location and make a more realistic assumption for
random(-10,10)
If the place where you live is close to a body of water, the temperature may not vary as much as we assumed earlier with our random(-10,10) function. It might be closer to random(-5,5), for example. Look closely at weather data from www.accuweather.com and make a better guess at the parameters of the random function to represent your city. Something to consider is whether your model is getting the unusually high or low temperature days right.
The first half of this video shows how to save your progress if you need to leave at any time. If you want to save your work, create an account and confirm a password. Nobody will sent you e-mails to bug you if you do this.
Note: You do not need to create an account to complete the activity, but you will need to create an account to save your work.
Click "Sign Up" in the top right, and create an account with a password.
Now when you open up the code in the editor, you can click "File" in the top left and "Duplicate" to copy a version of the code to your account. To open it, click the menu in the top right and go to "My Sketches". After editing the code, you can save your progress by clicking "File" and "Save".