This activity involves taking the code at the end of the Slingshot with Gravity exercise and doing some experiments with that code to learn more about the special properties of objects that are experiencing the gravitational pull from a central object. This central object can be a star or a black hole or a neutron star, etc. and the object in orbit can be a comet or an asteroid or a space capsule or even a whole planet. Usually this topic is connected to discussions of the motion of planets around a star.
Kepler made a number of important discoveries about the motion of the planets in the solar system. In the Slingshot with Gravity activity we created a code that demonstrated that $1/r^2$ forces like gravity naturally produce elliptical orbits. Hopefully you played around with that code to try to see if you could make orbits other than an ellipse. It turns out that as long as the object does not have enough kinetic energy to totally escape the gravitational field of the star it will produce some kind of elliptical orbit. Not only will the trajectory be an ellipse, the object will follow this same path every time it moves around the star. This result is often referred to as Kepler's first law. Kepler was an astronomer who looked closely at the orbits of planets like Venus and Mars.
In this activity we will consider Kepler's second law. Kepler's second law has to do with how quickly the planet moves in its elliptical orbit. Kepler showed that the area that the planet "sweeps out" over some interval of time is the same regardless what part of the orbit the planet is in. If you've never heard of Kepler's laws the sentence you just read about planets sweeping things out will probably not make much sense. Here is a video to explain Kepler's laws that has a nice animation.
Let's make our own animation using our code! We will do this in two steps:
The first thing we need to make an animation of Kepler's second law is to measure the period of the motion. Here is some code that you can add inside the draw function to show the period:
    tcounter1 += dt;
    drawText('counter time = ',0.01*width,0.7*height);
    drawText(tcounter1,0.06*width,0.65*height);

    // if the position of the object is near y = y_sun
    if ((abs(y - y_sun) < abs(vy)*dt) & (tcounter1 > dt) & vy > 0) {
      tlasttime1 = tcounter1;
      tcounter1 = 0; //Reset the clock
    }

    drawText('Period = ',0.01*width,0.6*height);
drawText(tlasttime1,0.06*width,0.55*height);Make sure to put this towards the end of the draw() function but not after the last curly bracket that says DO NOT ADD ANY CODE AFTER THIS LINE!!! The display() function will clear the screen so you need to avoid placing the drawText commands before the display() function
Run your program and see if it writes the period to the screen. How does the code that measures the period work? Can you make sense of what we just added? If not that's ok, but if you can figure it out that's great. (Hint: If you completed the Planetoids with a Spring activity you may notice some similarities to the code we used to measure the half cycle time.)
For the next step all you have to do is add this code near the beginning of sketch.js where the variables are initialized:
showareas = true;Inside of functions.js there is some code that is designed to calculate and draw the area for when the object goes for 1/8th of the period of the orbit. It does this twice per orbit and then it writes the numerical value for the two areas to the screen.
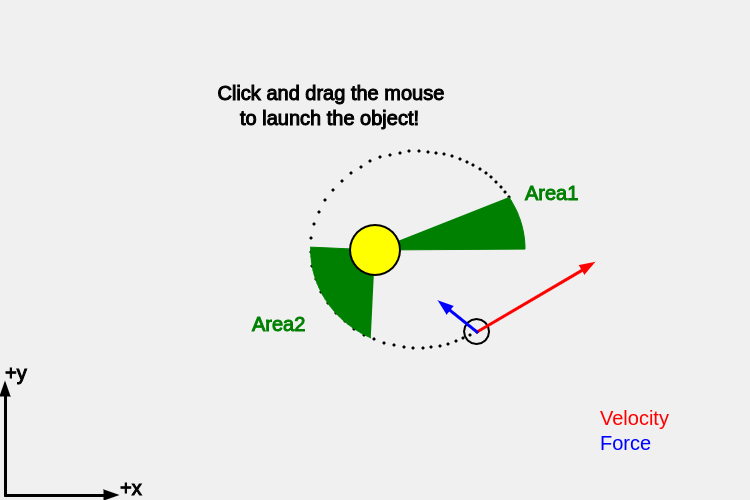
If you put this in the right place you will get something that looks overall similar to this:
According to Kepler's 2nd law the two areas should be the same because it is the same amount of time (1/8th of the orbital period) that they are being drawn. In our program you will find that they are pretty close but not exactly the same. It is important to do a calculation to get the percent difference. Usually we would do something like this:
$$ \% = 100 \cdot \frac{| \rm meas - true| }{\rm true} $$
But here we don't really know what the "true" area is supposed to be and we have two measurements. How should we modify this formula to get a percent difference for Area1 and Area2? (Hint: Area1 is about as good of an estimate of "true" as Area2 is).
Play around with the code and try out different parameters or click and drag to launch the object on an elliptical orbit. Compare the two areas for at least two different orbits. What number do you get for the percent difference and does it seem like we are pretty close (< 5%? < 1%?) or are we way off? What kind of percent difference is typical?
Kepler found that the two areas are the same so long as the object remains on a bound orbit (not zipping away to infinity). So you should find that Area1 and Area2 are close to the same. Thus far we have been checking this for the same launch velocity (boring!). Here is how to explore different launch velocities:
Similar to the Slingshot with Gravity activity you can click and drag the mouse to launch the object except that it only works in the Orbital Motion activity if you add this code to the beginning of your program:
usemouse = true;
Warning: If the orbiting object gets to close to the sun then the velocity and acceleration get so large that the code may make too many mistakes to give an accurate solution. A warning that says "too close!" will appear if this happens.
Advice: set usemouse = false; in the next part so you don't accidentally launch the object with the mouse.
According to Kepler, the two areas should be exactly the same. In the previous step you found that Area1 and Area2 are close but not quite the same. The reason for this is that the computer is breaking up the orbit into a number of finite timesteps in order to calculate the velocity, acceleration and position as a function of time. Each time we run the draw() function the time increases by dt. In the program dt means "delta time" or in math world $\Delta t$
So if we decrease dt from 0.1 to something smaller, the object will move less far each time we run the draw() function and the program will do a better job of calculating how the velocity, acceleration and position changes with time. If Kepler is correct, we should find that the two areas are closer to the same value when we decrease the timestep. In your program, decrease dt from 0.1 to 0.05 or smaller to see if the two areas are closer to the same value. The bad news is that the program will run much more slowly (so be patient!) but the answer will be much more accurate. Alas, life is full of trade-offs.
How small did you set dt and what was the percent difference that you found? Did the percent difference get smaller?
For the next part let's take a step back:
showareas = false;
The goal of Step 5 is to measure the "eccentricity" of the orbit. The eccentricity is a measure of how different from a circle the orbit is. An eccentricity of zero means that the orbit is a perfect circle. An eccentricity of 0.8 or higher means that the orbit is not very circular at all. The max eccentricity is 1.
We are going to measure the eccentricity by first measuring the max and the min distance in the orbit.
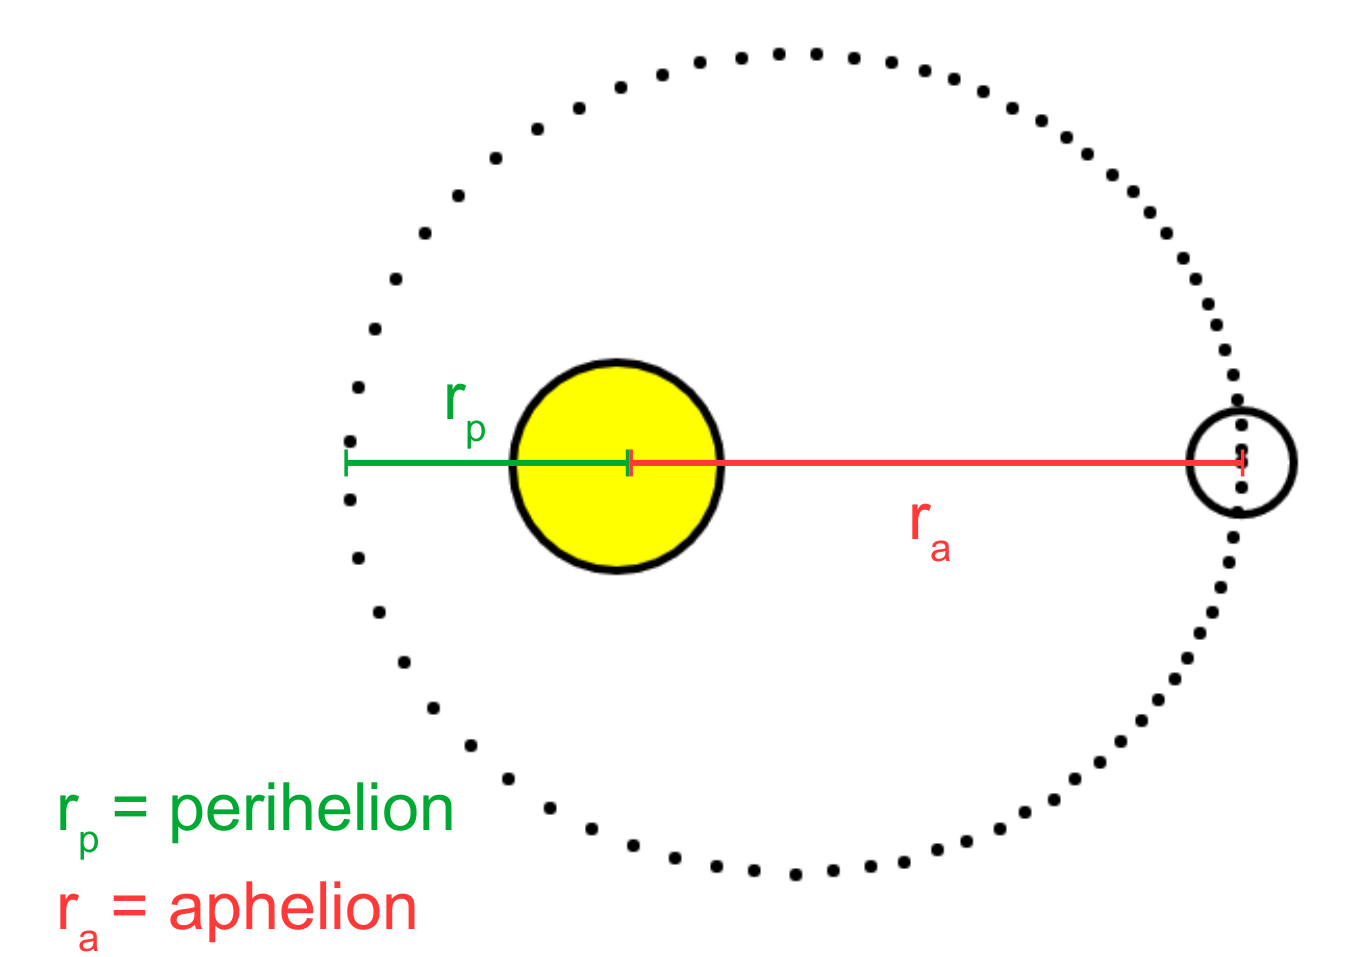
For an object orbiting the sun the max distance is called "aphelion" ($r_a$) and the closest distance is called "perihelion" ($r_p$). A helpful way to remember which one is the max distance is that "ap" means "away".
If we can measure $r_p$ and $r_a$ we can calculate the eccentricity from this formula: $$ {\rm eccentricity} = \frac{r_a - r_p}{r_a + r_p} $$
First add variables for rmax and rmin to the beginning of your code:
rmin = 1000;
rmax = 0;
Next, towards the end of the draw function add this code:
  drawText('Perihelion = ',width/2-125,height/2-125);
  if (rmin > r)    rmin = r;
  drawText(rmin,width/2+40,height/2-125);

  drawText('Aphelion = ',width/2-125,height/2-150);
  if (rmax < r)    rmax = r;
  drawText(rmax,width/2+40,height/2-150);
Now add code to calculate the eccentricity and write the value to the screen
    eccentricity = ????;  // fix this!
    drawText('eccentricity = ',width/2-100,height/2-200);
    drawText(eccentricity,width/2+25,height/2-200);
It's up to you to figure out what to replace ???? with. Note that for the default parameters (x = 525; y = 250; vx = 0; vy = 20;) you should get an eccentricity of 0.4
Now that your code can measure eccentricity, try to figure out the initial values for x,y,vx and vy that give you e = 0 (circular orbit), e = 0.5 (oval), and e = 0.8 (wide oval)
As you figure out these values write them down!
Kepler's 3rd law is a relationship between the period of the orbit and the distance that the object is orbiting. Larger distances take longer to complete an orbit which is why planets like Jupiter take many many (earth) years to orbit the sun whereas the earth, which is closer to the sun that Jupiter, makes an orbit of the sun every 365 days.
Kepler's third law states that the square of the period of the orbit (such as the period that we are measuring in our code) is related to the cube of the semi-major axis for the orbit. The semi-major axis is essentially how wide the ellipse is and then divide by two.
As a challenge, see if you can confirm the relationship between the period of the orbit and the semi-major axis. You can change the variables at the beginning of the code to give the object a different position or velocity, or you can set usemouse = true; and test out different positions and velocities that way.
Advice #1: If you can measure the closest distance ($r_{\rm min}$) and the furthest distance ($r_{\rm max}$) from the program then the semi-major axis would just be $(r_{\rm max} + r_{\rm min})/2$
Advice #2: Part of what makes this challenging is that if the object gets too close to the sun then the velocity and acceleration get so large that the code may make too many mistakes to give an accurate solution. A warning that says "too close!" will appear if this happens.