The image above is not an actual picture of the night sky or any real star field (maybe you've already noticed that its a fake!). It is a randomly-generated night sky from a computer program we are going to build. We are going to learn a little bit about stars and then we are going to think about why some stars appear brighter in the sky than others and what it means.
An interesting thing about this activity is that you will be able to download a spreadsheet with the list of randomly generated stars. In the directions here we will use Google sheets to analyze that data but you can use any spreadsheet program you are comfortable with (Excel, Libreoffice, Apple -- Numbers)
Click on this link to open the code
Press play there to run the code.
Here is the code we are using:
Nstars = 0;

function draw() {
   x = random(0,500); // position on screen
   y = random(0,500); // position on screen
   z = random(2,20); // = distance to star (in lightyears)

   drawStar(x,y,10000.0); // x,y,brightness

   Nstars += 1;
   print('Generated '+ Nstars + ' stars');

   if (Nstars >= 200) {
     noLoop();  // stop generating stars
     print("finished generating " + Nstars + " stars!");
   }
}
What do you notice about this code? Here are some questions to think about:
How would you explain the different 'sections' of the code to a friend and what they do?
Is there a variable there that we don't use?
There is an interesting feature of the code that if you change this:
drawStar(x,y,10000.0);to this:
drawStar(x,y,100000.0);
then the size of the little circles will be bigger like it is in this demo.
Note: You can right click the star field and click "Save Image As..." to save the star field as a png image. If you really like the stars you generated you can save it.
It turns out that stars are so far away from us that the size of the star doesn't matter for how big it appears. Even the biggest telescopes on earth and even the best space telescopes can't detect the physical size of a star just from looking at it. What really does matter for how big the star appears in the sky or in our telescopes is how bright it is -- how much light is reaching us from that star.
Here is the formula for the brightness ($B$) of a star that we are observing from earth: $$B = \frac{L}{4 \pi d^2} $$
where $L$ is the energy per second that the star is emitting. Another name for the energy per second emitted by a star is "luminosity". (Note: The $4 \pi d^2 $ is the area of a sphere.)
In the code we are going to use something very similar to this. Here is the code:
  luminosity = 1.0; // fraction of the luminosity of the sun
  brightness = 1000000.0*luminosity/(4*3.141*z*z);
  drawStar(x,y,brightness);
Note: The factor of 1000000.0 in the code above is there to make sure that the brightness numbers are greater than one when we analyze it later.
Copy paste this into your code and remove drawStar(x,y,100000.0);. When you do this your code should behave like this.
What do you notice about this code? Does it use an unused variable? What assumptions does it make?
The sun is a pretty average star in most ways, and in the previous step we assumed that all the stars in our artificial night sky have the same luminosity as the sun. We can do better than this. Some stars are more luminous than the sun and other stars are less luminous. It turns out this has to do with the mass of the star.
Here is the formula for the luminosity of a star for a particular mass: $$ L_{\rm star} = L_{\rm sun} \cdot \left(\frac{M_{\rm star}}{M_{\rm sun}} \right)^4 $$
It turns out that more massive stars are also much hotter. Hotter stars emit more radiation.
A helpful thing to do is to rewrite this equation like this: $$ \frac{L_{\rm star}}{ L_{\rm sun}} = \left(\frac{M_{\rm star}}{M_{\rm sun}} \right)^4 $$
Another helpful thing is to define $L$ as the ratio of the luminosity to solar luminosity like this: $$ L = \frac{L_{\rm star}}{L_{\rm sun}} $$
As you can see, if the luminosity of the star is the same as the luminosity of the sun then $L = 1$, which is essentially what our program already does.
Finally, another helpful thing is to define mass $M$ as the ratio of the mass of the star to the mass of the sun: $$ M = \frac{M_{\rm star}}{M_{\rm sun}} $$
This means that if the mass of the star is the same as the mass of the sun then $M = 1$.
Combining these two things you can just write this: $$L = M^4 $$
This will be helpful for the code in the next step.
Question: Stars that are twice as massive as the sun are ____ times more luminous than the sun.
First we need to randomly generate a mass. Add the highlighted code to randomly generate a value for M right below where we randomly generate x, y, and z coordinates:
   x = random(0,500); // position on screen
   y = random(0,500); // position on screen
   z = random(2,20); // = distance to star (in lightyears)
   M = random(0.25,2); // = star mass (relative to the sun)
Here is a copy code button for just the new code:
M = random(0.25,2); // = star mass (relative to the sun)
Then, as discussed in the previous step, you should replace this:
luminosity = 1.0; // fraction of the luminosity of the sun
with this:
luminosity = pow(M,4.0); // fraction of the luminosity of the sun
If you make these changes your code should behave like this
Let's save the data to a spreadsheet file called stars.csv
Add this line to the program in the middle:
saveValues(brightness,luminosity,M,z,y,x);
Then inside of the if statement (which only runs when the program is done generating stars) add this code:
saveTable(table,'stars.csv');
So now your program should have two new lines like this:
   saveValues(brightness,luminosity,M,z,y,x);
   if (Nstars >= 200) {
     saveTable(table,'stars.csv');
     noLoop();  // stop generating stars
     print("finished generating " + Nstars + " stars!");
   }
Open stars.csv in a spreadsheet program (any spreadsheet program).
Put a box around the entire data set and click the Data tab. Your goal is to sort the stars by the numbers in the first column, which is the brightness. This way we will end up with a list of the stars from brightest to dimmest.
In google sheets you would highlight the entire data set and click Data --> Sort Sheet by Column A, Z --> A like in this screenshot:
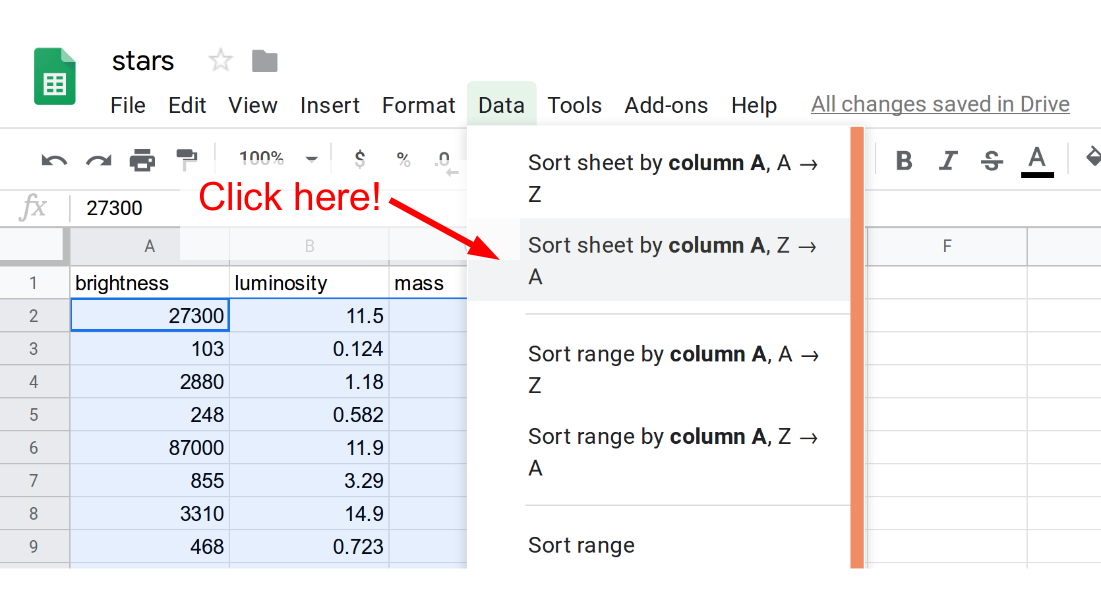
Note: If you are using some other spreadsheet program like Excel it won't be exactly like this. But usually there is a Data tab at the top and a "Sort" option.
Put a box around the entire data set and sort the stars according to distance (z). Is the brighest star also the closest star? If the brightest star is also the closest star, run the program again to see if this is always true.
Note: Here is a list of the closest star systems. Sirius is the brightest star in the sky. Is it also the closest?
Step 1. Check the max and min value of the mass
In the program we are using this code to generate a random value for the mass of a star:
M = random(0.25,2.0);
As you can see, this will generate a random number for the mass of the star with the lowest possible value being 0.25 (one quarter the mass of the sun) and the highest value being 2.0 (twice the mass of the sun).
The third column of data is the mass of the star. Sort the data according to the third column to figure out the max and min mass of the star. Do the results for the max and min match up with what you expect?
Step 2. Check the average value of the mass
Go to C 202 and type in this:
=AVERAGE(C2:C201)
Don't forget to type the equals sign! The equals sign is important because if you leave it out, the program just thinks you are trying to write the word "Average" to the screen.
What value do you get for the average mass? We said earlier that the sun is a pretty average star. Is the average mass close to 1.0? You may notice that the average mass is not exactly equal to 1.0. Can you explain that?
Step 3. Change the way the mass is randomly generated
It turns out that there are better models for randomly generating the mass of the star than the one we are using M = random(0.25,2.0); You can switch to a more realistic model by removing that code and adding this code:
M = salpeter_random_mass();
We could just tell you how this model differs from the one we used earlier M = random(0.25,2.0); but where is the fun in that? Generate a star field with this new model and analyze the data like you did with the earlier model.
Here are some questions you should try to answer:
What is the min and max values of the mass for this new model? What is the average mass with the new model? Is there any noticable visual difference between star fields that were generated with this new model and star fields that were generated with the old model?
Note: This new model is called the "Salpeter Initial Mass Function" if you are curious to google around to learn more about it.
For a variety of reasons we limit the number of stars that we are generating to 200. Doing more than this takes longer and it creates more data to analyze which is doable but it can be a bit slow.
It turns out that if brightness is below about 5000 then the star is so small then you can't even see a little dot on the star field.
Add an if statement to the program so it only draws the star if the brightness is above 5000
Note: Make sure your code still draws 200 stars on the screen! Only increase Nstars if the star is bright enough to be visible!
If you modify your code correctly you should get a star field that somewhat like this:
Note #1: Your star field will look different because it is using a different set of random numbers, but overall does it look similar?
Note #2: The image above assumes M = random(0.25,2.0); You can also use M = salpeter_random_mass(); as discussed in challenge #1 to see what it looks like.
Why is checking the brightness important for generating a realistic star field?
Not all stars are white. In astronomy there is a way to plot the brightness of stars versus their color that is called the Hertzsprung-Russell Diagram. There are many different types of stars on the diagram. Most of the stars on the diagram are "main sequence" stars. The sun is an example of a main sequence star.
Lower mass main sequence stars are cooler (lower temperature) and higher mass main sequence stars are hotter (higher temperature). This means that lower mass stars emit red light than higher mass stars which emit blue light. The sun is in the middle of this range and it emits yellow light that is in the middle of the color spectrum.
Our program has an option to give the star a color using RGB. This is three numbers (red green blue) that each go from 0 to 255. For example, if you wanted to make the stars all red you could use this code:
drawStar(x,y,brightness,[255,0,0]);
Here is a link to a page where you can see what colors different RGB values make
See if you can modify the code to make the lower mass stars red and the higher mass stars blue!