 , which will deposit a lot of
energy,
from
  , cosmic rays, or other events
which deposit relatively little energy. Figure
The pulse height of the signal from the analyzer can be used to
differentiate the good  , which will deposit a lot of
energy,
from
  , cosmic rays, or other events
which deposit relatively little energy. Figure
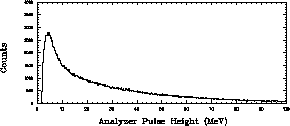
 ![]() shows the
distribution of the energy deposited in the analyzer planes which is
essentially the pulse height signal from those planes.
shows the
distribution of the energy deposited in the analyzer planes which is
essentially the pulse height signal from those planes.

Figure: Raw histogram of the pulse height distribution of hits in the
analyzer planes of the polarimeter. The pulse height is proportional to
the energy deposited in those planes.
A plot of the polar scattering angle,  , versus the analyzer pulse
height more clearly separates the
  events from all others.
Figure
 ![]() shows this plot.
shows this plot.

Figure: Polar scattering angle,  , versus the analyzer pulse
height. The branch labelled (A) are primarily the
  events
while those in the box marked (B) are
  events,
cosmic ray events, and others that deposit very little energy.
The  events show a higher energy deposition in the
analyzer, particularly for greater scattering angles. Most of the rest of
the events have a very small pulse height regardless of the scattering
angle. A cut on the data of the type defined by the box (A) in figure
![]() was investigated, but it was found that such a 2-d cut does
not provide any better a FOM than did cuts on individual pulse height and
was investigated, but it was found that such a 2-d cut does
not provide any better a FOM than did cuts on individual pulse height and
 spectra.