


Next: Data
Up: RESULTS
Previous: Beam Polarization
The  spin-observables presented in this section were extracted
from the quasifree scattering data taken during experiments E385 and E387.
The quasifree region was split into 10 MeV bins which seemed to provide
reasonable statistics to extract the observables while still providing a
good picture of the energy dependence. The results from the data taken
with the normally polarized
  beam, which includes
 ,
, 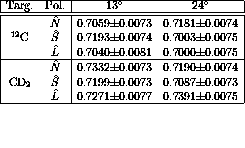 , and P (induced polarization), are listed on
tables
  and
and  for
for  and
and
 , respectively.

Table: Spin-observable results from the
 reaction at
  for an
  polarized proton beam with
  MeV.
MeV.

Table: Spin-observable results from the
 reaction at
 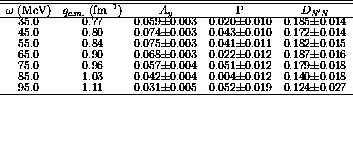 for an
  polarized proton beam with
  MeV.
MeV.
These results are shown in graphical format in figure  compared to
results from recent Faddeev type calculations [Wit96] of the deuterium
observables. The analyzing power and
induced polarization seem to be in reasonable agreement. Both show
rather small magnitudes. However, in
  there is significant
disagreement between the
  data and both the Faddeev calculations
and the
  data.
data.

Figure: Spin-observable results from the
 and
and  reactions at
  for an
  polarized proton beam with
  MeV. The
excitation spectra are shown at the top. The dashed line show the results
of Faddeev calculations of the spin-observables for the deuterium
reaction. The vertical dotted line indicate the energy loss for free np
scattering.
The results for the sideways and longitudinal incident beams for the
 reaction are compiled in tables
 and
and  , respectively. Similarly, the
spin-observables from the
  are shown in
tables
  and
and  for the sideways and
longitudinally polarized beams, respectively.

Table: Spin-observable results from the
 reaction at
  for an
  polarized proton beam with
  MeV.
MeV.

Table: Spin-observable results from the
 reaction at
 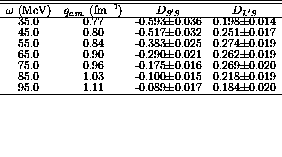 for an
  polarized proton beam with
  MeV.
MeV.

Table: Spin-observable results from the
 reaction at
 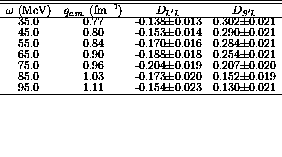 for an
  polarized proton beam with
  MeV.
MeV.

Table: Spin-observable results from the
 reaction at
 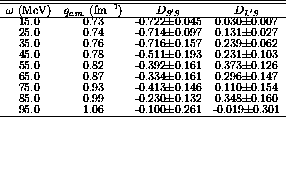 for an
  polarized proton beam with
  MeV.
MeV.
The results from the sideways and longitudinal data are also shown in
figures  and
and  , respectively. Generally, it seems that
the Faddeev calculations predict the
  results fairly well for
all the in-plane spin observables with possible exception of
 . The
. The  and
and  results also seem to
follow the same trends.

Figure: Spin-observable results from the
 and
and  reactions at
  for an
  polarized proton beam with
  MeV. The
excitation spectra are shown at the top. The dashed line show the results
of Faddeev calculations of the spin-observables for the deuterium
reaction. The vertical dotted line indicate the energy loss for free np
scattering.

Figure: Spin-observable results from the
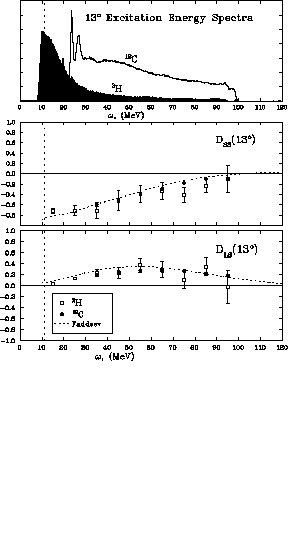 and
and  reactions at
  for an
  polarized proton beam with
  MeV. The
excitation spectra are shown at the top. The dashed line show the results
of Faddeev calculations of the spin-observables for the deuterium
reaction. The vertical dotted line indicate the energy loss for free np
scattering.
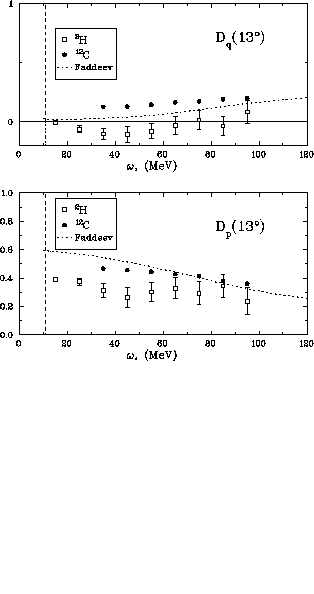
The center-of-mass spin observables,  's, are shown in figures
 and
and  . These results are also compared to the
results of Faddeev calculations (shown with the dashed line).

Figure: 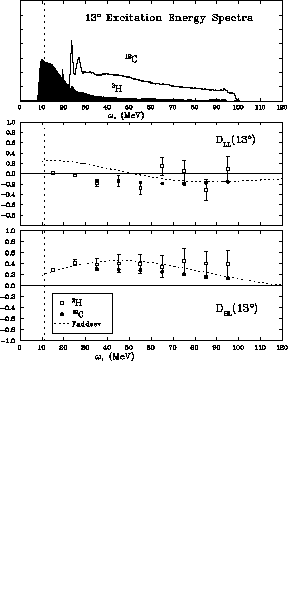 (spin 0) and
  (spin transverse,
 )
spin observables as a function of energy loss at
 .
Results from both deuterium and carbon are shown. The short-dashed line
are the results of Faddeev calculations of the deuterium spin observables.
The long-dashed line shows the free np scattering results based on the
Argonne potential.
The vertical dotted line indicates the energy loss for free np scattering.

Figure: 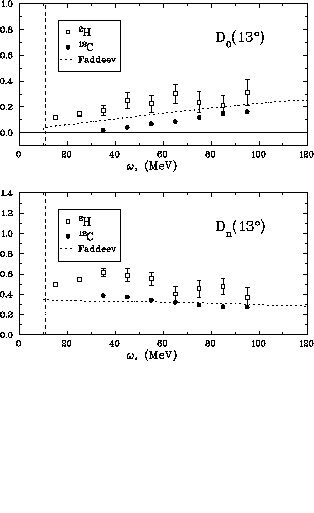 (spin longitudinal,
  ) and
) and  (spin transverse,
  )
spin observables as a function of energy loss at
 .
Results from both deuterium and carbon are shown. The short-dashed line
are the results of Faddeev calculations of the deuterium spin observables.
The long-dashed line shows the free np scattering results based on the
Argonne potential.
The vertical dotted line indicates the energy loss for free np scattering.
The  results have been presented for completeness but it is
unclear if any conclusions regarding quasifree scattering can be drawn
from them. The range of energy
loss over which data was gathered, as shown at the top of figure
  for example, spans a momentum transfer of
  fm
fm to
to
 fm
fm . In this range quasifree scattering is just
beginning
to turn on. That is, the momentum transferred to the stationary nucleon in
the nucleus is barely sufficient for knock-out, which defines quasifree
scattering. Also, in this region of momentum transfer measured at
 the pion effects are going to be very small.
From figure
  one can see that the expected longitudinal
contribution from the pion is around zero. This supported by the fact that
the longitudinal spin observable
  is essentially zero in figure
 . To look for a change in nuclear response functions due to an
enhanced pion field it is reasonable to look other momentum transfers where
the pion residual interaction in non-zero.
It is worth mentioning at this point that data were taken at  primarily because
  was considered to be a possibly interesting
angle. That meant that the INPOL detector had to gather
  data
while the KSU detector gathered data at
  .
.


Next: Data
Up: RESULTS
Previous: Beam Polarization
Michael A. Lisa
Tue Apr 1 08:52:10 EST 1997
 spin-observables presented in this section were extracted
from the quasifree scattering data taken during experiments E385 and E387.
The quasifree region was split into 10 MeV bins which seemed to provide
reasonable statistics to extract the observables while still providing a
good picture of the energy dependence. The results from the data taken
with the normally polarized
  beam, which includes
 ,
,  , and P (induced polarization), are listed on
tables
  and
and
 , respectively.

 reaction at
  for an
  polarized proton beam with
  MeV.
MeV.
 reaction at
  for an
  polarized proton beam with
  MeV.
MeV. there is significant
disagreement between the
  data and both the Faddeev calculations
and the
  data.
data.

 and
and  reactions at
  for an
  polarized proton beam with
  MeV. The
excitation spectra are shown at the top. The dashed line show the results
of Faddeev calculations of the spin-observables for the deuterium
reaction. The vertical dotted line indicate the energy loss for free np
scattering.
 reaction are compiled in tables
 are shown in
tables
 reaction at
  for an
  polarized proton beam with
  MeV.
MeV.
 reaction at
  for an
  polarized proton beam with
  MeV.
MeV.
 reaction at
  for an
  polarized proton beam with
  MeV.
MeV.
 reaction at
  for an
  polarized proton beam with
  MeV.
MeV. results fairly well for
all the in-plane spin observables with possible exception of
 . The
. The  and
and  results also seem to
follow the same trends.

 and
and  reactions at
  for an
  polarized proton beam with
  MeV. The
excitation spectra are shown at the top. The dashed line show the results
of Faddeev calculations of the spin-observables for the deuterium
reaction. The vertical dotted line indicate the energy loss for free np
scattering.
 and
and  reactions at
  for an
  polarized proton beam with
  MeV. The
excitation spectra are shown at the top. The dashed line show the results
of Faddeev calculations of the spin-observables for the deuterium
reaction. The vertical dotted line indicate the energy loss for free np
scattering.
 's, are shown in figures

 (spin 0) and
  (spin transverse,
 )
spin observables as a function of energy loss at
 .
Results from both deuterium and carbon are shown. The short-dashed line
are the results of Faddeev calculations of the deuterium spin observables.
The long-dashed line shows the free np scattering results based on the
Argonne potential.
The vertical dotted line indicates the energy loss for free np scattering.
 (spin longitudinal,
  ) and
) and  (spin transverse,
  )
spin observables as a function of energy loss at
 .
Results from both deuterium and carbon are shown. The short-dashed line
are the results of Faddeev calculations of the deuterium spin observables.
The long-dashed line shows the free np scattering results based on the
Argonne potential.
The vertical dotted line indicates the energy loss for free np scattering.
 results have been presented for completeness but it is
unclear if any conclusions regarding quasifree scattering can be drawn
from them. The range of energy
loss over which data was gathered, as shown at the top of figure
  fm
fm to
to
 fm
fm . In this range quasifree scattering is just
beginning
to turn on. That is, the momentum transferred to the stationary nucleon in
the nucleus is barely sufficient for knock-out, which defines quasifree
scattering. Also, in this region of momentum transfer measured at
 the pion effects are going to be very small.
From figure
  is essentially zero in figure
 primarily because
  was considered to be a possibly interesting
angle. That meant that the INPOL detector had to gather
  data
while the KSU detector gathered data at
  .
.