

Next: Response Functions
Up: RESULTS
Previous: Data
The data presented in this section were taken in the KSU `` ''
polarimeter. Sitting on the
  flight path this polarimeter
collected data at
  and
and  . Primary analysis of the
laboratory frame spin observables,
  's, was done
at IUCF by persons other than the author and is presented here to try
to get a complete picture of the results from experiments E385 and E387.
The  data are the only data from the KSU ``
 '' polarimeter
to be presented. The reason for this is that at
  the cross
section for both the
  and
and  reaction
have dropped to the point that sufficiently few statistics were gathered so
as to make results of questionable value. For
  data it was
necessary to bin the data in the quasifree peak by 20 MeV to get acceptable
uncertainties. The KSU detector was able to measure the quasifree peak out
to a larger energy loss, as can be seen in the data below, because it sat
at a shorter flight path than the INPOL detector. This meant the slower
neutrons from the tail of the quasifree distribution had time to get to the
detector before the fastest neutrons from the following proton pulse
arrived. This was useful because at the higher angles the peak of the
neutron energy distribution moves to higher energy loss.
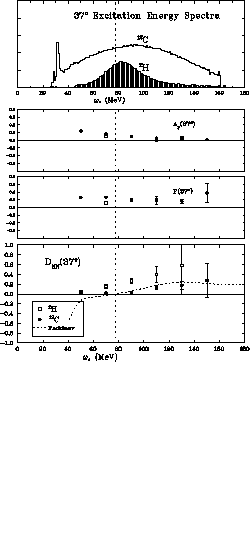
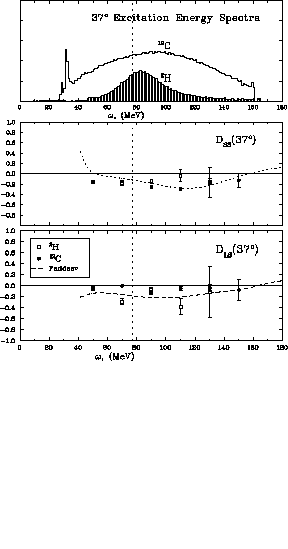
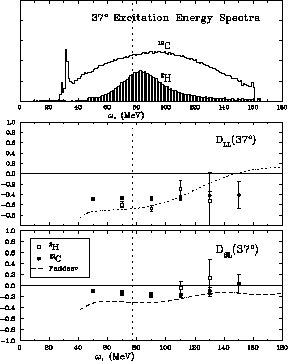
The spin observables from the  polarized beam are shown in
figure
  along with the relative cross section of the
 and
and  reactions. Similar results are shown for
  polarized beam and
 polarized beam in figures
  and
and  ,
respectively.

Figure: Spin-observable results from the
 and
and  reactions at
  for an
  polarized proton beam with
  MeV. The
excitation spectra are shown at the top. The dashed line show the results
of Faddeev calculations of the spin-observables for the deuterium
reaction. The vertical dotted line indicate the energy loss for free np
scattering.

Figure: Spin-observable results from the
 and
and  reactions at
  for an
  polarized proton beam with
  MeV. The
excitation spectra are shown at the top. The dashed line show the results
of Faddeev calculations of the spin-observables for the deuterium
reaction. The vertical dotted line indicate the energy loss for free np
scattering.

Figure: Spin-observable results from the
 and
and  reactions at
  for an
  polarized proton beam with
  MeV. The
excitation spectra are shown at the top. The dashed line show the results
of Faddeev calculations of the spin-observables for the deuterium
reaction. The vertical dotted line indicate the energy loss for free np
scattering.
In general, as with the  and
and  data, the
  measurement of the
  's
tends to follow the Faddeev calculations [Wit96]. The agreement
is not perfect but, for the most part, the trends are the same. The
Faddeev calculations for
  and induced polarization (figure
  )
at
)
at  were not available.
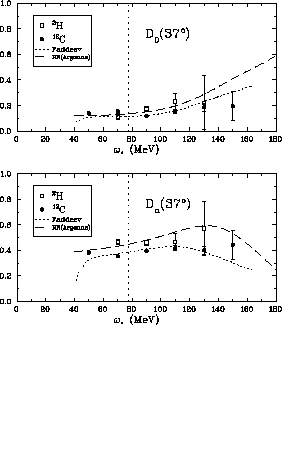
The center-of-mass spin observables,  's, are shown in figures
 and
and  . These results are also compared to the
results of Faddeev calculations (shown with the short-dashed line) and to
free np scattering (shown with the long-dashed line) from calculations
based on the Argonne potential.

Figure:  (spin 0) and
  (spin transverse,
 )
spin observables as a function of energy loss at
 .
Results from both deuterium and carbon are shown. The short-dashed line
shows the
results of Faddeev calculations of the deuterium spin observables. The
long-dashed line shows the free np scattering results based on the Argonne
potential.
The vertical dotted line indicates the energy loss for free np scattering.

Figure:  (spin longitudinal,
  ) and
) and
 (spin transverse,
  )
spin observables as a function of energy loss at
  .
Results from both deuterium and carbon are shown. The short-dashed line
shows the
results of Faddeev calculations of the deuterium spin observables. The
long-dashed line shows the free np scattering results based on the Argonne
potential.
The vertical dotted line indicates the energy loss for free np scattering.
The same conclusions drawn based on the  center-of-mass spin
observables can not necessarily be made with the
  data. In both
transverse observables (
 and
and  ) there is a noticeable difference
between the deuterium and carbon results, and the deuterium is seemingly
consistent with the free np calculations. Interestingly, the results from
the Faddeev calculations seem to be doing a worse job of predicting the
 observables than the free np scattering
results based on the Argonne potential.


Next: Response Functions
Up: RESULTS
Previous: Data
Michael A. Lisa
Tue Apr 1 08:52:10 EST 1997
 ''
polarimeter. Sitting on the
  flight path this polarimeter
collected data at
  and
and  . Primary analysis of the
laboratory frame spin observables,
  's, was done
at IUCF by persons other than the author and is presented here to try
to get a complete picture of the results from experiments E385 and E387.
 data are the only data from the KSU ``
 '' polarimeter
to be presented. The reason for this is that at
  the cross
section for both the
  and
and  reaction
have dropped to the point that sufficiently few statistics were gathered so
as to make results of questionable value. For
  data it was
necessary to bin the data in the quasifree peak by 20 MeV to get acceptable
uncertainties. The KSU detector was able to measure the quasifree peak out
to a larger energy loss, as can be seen in the data below, because it sat
at a shorter flight path than the INPOL detector. This meant the slower
neutrons from the tail of the quasifree distribution had time to get to the
detector before the fastest neutrons from the following proton pulse
arrived. This was useful because at the higher angles the peak of the
neutron energy distribution moves to higher energy loss.
 polarized beam are shown in
figure
  and
and  reactions. Similar results are shown for
  polarized beam and
 polarized beam in figures
 and
and  reactions at
  for an
  polarized proton beam with
  MeV. The
excitation spectra are shown at the top. The dashed line show the results
of Faddeev calculations of the spin-observables for the deuterium
reaction. The vertical dotted line indicate the energy loss for free np
scattering.
 and
and  reactions at
  for an
  polarized proton beam with
  MeV. The
excitation spectra are shown at the top. The dashed line show the results
of Faddeev calculations of the spin-observables for the deuterium
reaction. The vertical dotted line indicate the energy loss for free np
scattering.
 and
and  reactions at
  for an
  polarized proton beam with
  MeV. The
excitation spectra are shown at the top. The dashed line show the results
of Faddeev calculations of the spin-observables for the deuterium
reaction. The vertical dotted line indicate the energy loss for free np
scattering.
 and
and  data, the
  measurement of the
  's
tends to follow the Faddeev calculations [
 and induced polarization (figure
  were not available.
 's, are shown in figures

 (spin 0) and
  (spin transverse,
 )
spin observables as a function of energy loss at
 .
Results from both deuterium and carbon are shown. The short-dashed line
shows the
results of Faddeev calculations of the deuterium spin observables. The
long-dashed line shows the free np scattering results based on the Argonne
potential.
The vertical dotted line indicates the energy loss for free np scattering.
 (spin longitudinal,
  ) and
) and
 (spin transverse,
  )
spin observables as a function of energy loss at
  .
Results from both deuterium and carbon are shown. The short-dashed line
shows the
results of Faddeev calculations of the deuterium spin observables. The
long-dashed line shows the free np scattering results based on the Argonne
potential.
The vertical dotted line indicates the energy loss for free np scattering.
 center-of-mass spin
observables can not necessarily be made with the
  data. In both
transverse observables (
 and
and  ) there is a noticeable difference
between the deuterium and carbon results, and the deuterium is seemingly
consistent with the free np calculations. Interestingly, the results from
the Faddeev calculations seem to be doing a worse job of predicting the
 observables than the free np scattering
results based on the Argonne potential.