V.B.3.a. Mapping the galaxy with CO
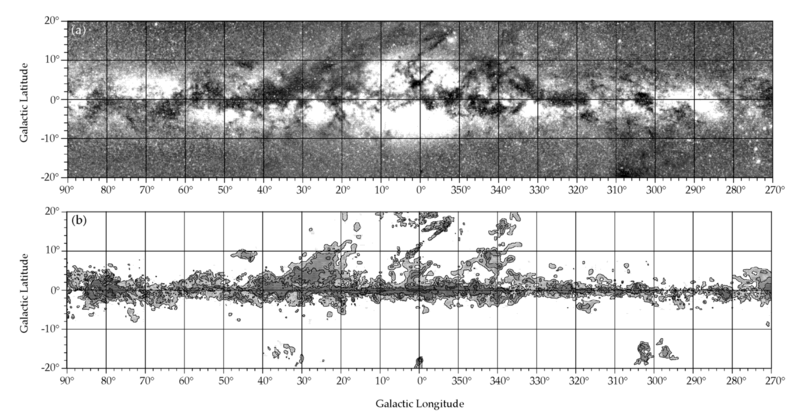
Figure V.B.3.a-1 shows a comparison between an optical image of the galaxy (top) and an emission map of the J = 1 →0 of CO at 115 GHz (bottom). The astrophysical significance of this comparison is the close correlation between the CO emission and the optical obscuration, showing that regions where the gas and dust densities are high enough to allow molecules to form also produce optical 'dark clouds’. [1] Figure V.B.4.a-2 shows a more detailed map of the CO emission from giant molecular clouds (GMCs) located in the Perseus arm of our galaxy.[2] These GMCs contain a significant fraction of the mass of the interstellar matter in the Milky Way, each with a mass of the order 106 that of our sun. These maps are based on data obtained with the 1.2 m telescope listed in Table V.B.1-1 and currently located at the Center for Astrophysics. This telescope has been dedicated to CO surveys for about 25 years and has produced a significant body of results. Briefly, it is a multiplex heterodyne system , with an SIS mixer, Gunn local oscillator and a 1.4 GHz IF frequency, and a 256 channel spectrometer. These maps are also a good example of more general Submillimeter /Terahertz capabilities: the ability to penetrate particulate matter and to accurately measure small frequency shifts. Although the dust makes up only a relatively small fraction of the interstellar matter, it scatters light so as to make much of the most interesting galactic regions unobservable. These maps of CO are possible and astrophysically significant for three reasons. First, CO is relatively abundant and its presence is highly correlated with the numerically more abundant (but difficult to observe H2 and He). Second, its radiation at 115 GHz readily penetrates the dust content of the clouds. Finally, its sharp spectral resonance makes possible not only its unambiguous identification, but also the measurement of Doppler shifts which results both from local galactic turbulence as well as the over-all rotation of the galaxy.
Figure V.B.3.a-1. A comparison between the galactic optical emission (top) and the J = 1 → 0 emission of CO (bottom).
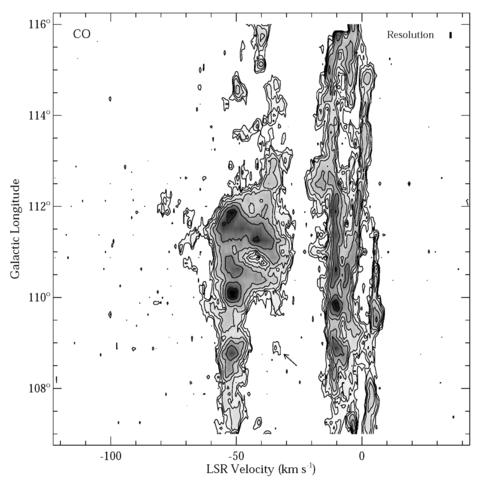
Figure V.B.3.a-2.
Back to V.B. Astronomical Spectroscopy
[1] T.M. Dame, D. Hartmann, P. Thaddeus, Ap. J., 547 (2001) 792-813.
[2] H. Ungerechts, P. Umbanhowar, P. Thaddeus, Ap. J., 537 (2000) 221-235.