V.B.4.b QM Catalog completeness
As an illustration, we have completed experimental work for eight well known astrophysical weeds: ethyl cyanide methyl formate, acetaldehyde, dimethyl ether, methanol, sulfur dioxide, methyl cyanide, and vinyl cyanide in the 210 – 270 GHz region.
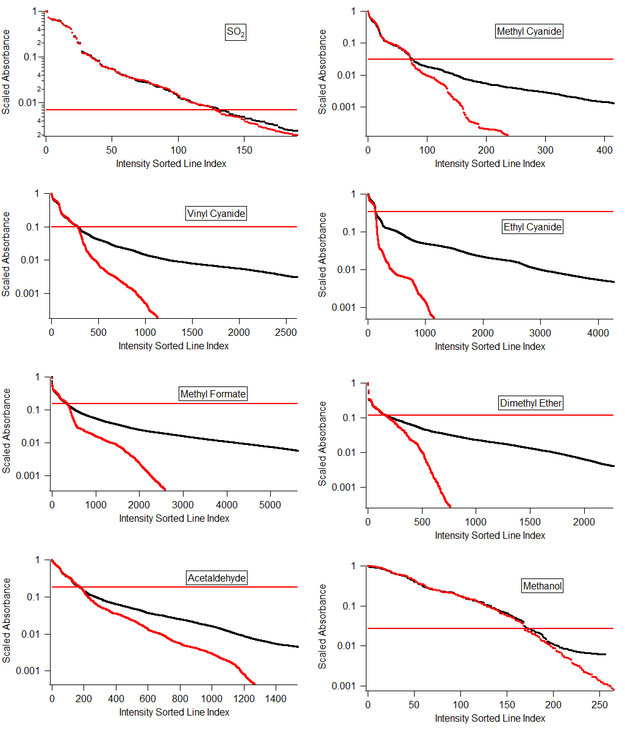
Figure V.B.4.b-1
Figure V.B.4.b-1 shows catalog completeness in a graphical format. In this figure, the observed experimental lines (which are presumably complete) are sorted according to intensity, as are the QM catalog lines. As long as the QM catalog is complete, these two plots will overlap, diverging at the intensity of the strongest line that is not included in the QM catalog.
For semi-rigid molecule the rotational structure in these excited states will be similar to that of the ground state. With this assumption, it would be expected that the strongest lines not included in the catalog would be reduced from the strongest lines in the spectrum by the vibrational Boltzmann factor for these vibrational states. Inspection of Figure V.B.4.b-1 shows that this expectation is realized. For molecules with internal rotation, somewhat more complex considerations are required to account for degeneracies. Additionally for molecules such as methanol, which have spectra that is strongly torsional state dependent, the divergence will be much more gradual.
The location of this divergence as a function of temperature is an important astrophysical question. Although much of the interstellar medium is at low temperature, the ability of telescope arrays to resolve smaller hot cores has resulted in the observation of much higher temperatures. For example, it has been shown with the SMA and using methyl cyanide as a probe that the temperature measured for the Orion KL hot core has continually increased with increasing telescope angular resolution, with temperatures over 600 K observed in the latest study [1]. In another example, using the SMA in G19.61-0.23 a rotational temperature of 578 ± 134 K has been measured for ethyl cyanide and 609 ± 77 K for methyl cyanide [2]. With the high angular resolving power of ALMA, even smaller and hotter cores should be observed.
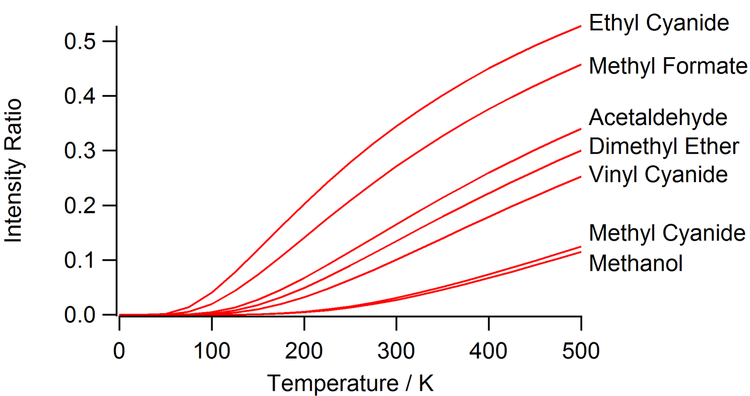
Figure V.B.4.b-2. The intensity of the strongest line not included in the QM catalog relative to the strongest line in the spectrum as a function temperature.
Accordingly, Fig. V.B.4.b-2 shows these intensity factors over the 100 – 500 K range for the excited state of vinyl cyanide near 460 cm-1, as well as for a number of other astrophysical weeds. Unlike the case of ethyl cyanide, for which only an analysis of the unperturbed ground vibrational is included in the catalogs, the inclusion of even the truncated analyses of the excited states of vinyl cyanide significantly reduces the intensities of the lines which are not included in the catalogs.
Figures V.B.4.b-3 and V. B.4.b-4 show examples of this lack of completeness in the QM catalogs.
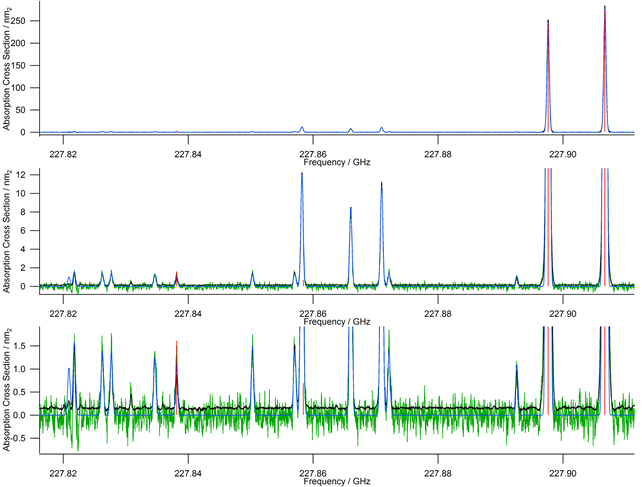
Figure V.B.4.b-3. A small segment of the spectrum of vinyl cyanide at 300K - expanded from top to bottom. The green trace is one of the ~400 experimental scans. The black trace is the CES simulation based on a frequency point-by-point analysis. The blue trace is the CES simulation based on a catalog derived from the CES, and the red sticks the QM catalog simulation. Note that near 227.86 GHz the QM simulation is much smaller than the observed spectral line, indicating an overlap of a weak predicted line by a stronger uncataloged line.
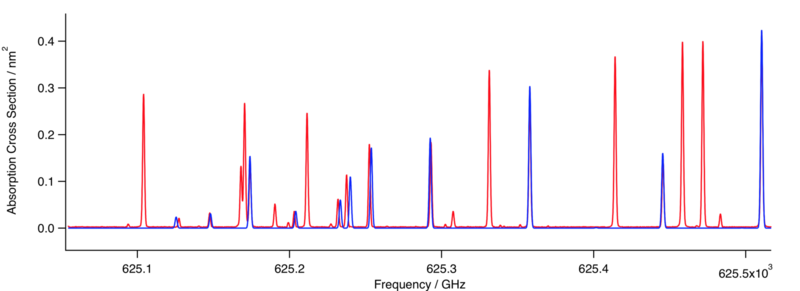
Figure V.B.4.b-4. A small segment of the spectrum of methanol near 625 ghz, The blue trace is a spectrum simulated from the QM catalog and the red trace a simulation based on the CES.
Back to V.B.Astronomical Spectroscopy
[1] K.-S. Wang, Y.-J. Kuan, S.-Y. Liu, S.B. Charnley, Ap. J., 713 (2010) 1192-1206.
[2] S.-L. Qin, Y. Wu, M. Huang, G. Zhao, D. Li, J.-J. Wang, S. Chen, Ap. J., 711 (2010) 399-416.