V.B.4.e.3.i. Methyl Cyanide
We will start with methyl cyanide to illustrate effects of optical thickness, rotational and vibrational temperatures, and isotope effects. In the comparisons the offset of ~ 1 Jy/beam between the simulation and the ALMA spectrum is due to the non-spectral line continuum of the Orion KL hot core region measured by ALMA. While we have normalized the intensity of the simulation to that of the spectral lines of the ALMA spectrum, we have left the offset because it facilitates comparison between the simulation and the ALMA spectrum. For other comparisons of weaker spectra shown below, this offset is reduced so as to minimize white space.
|
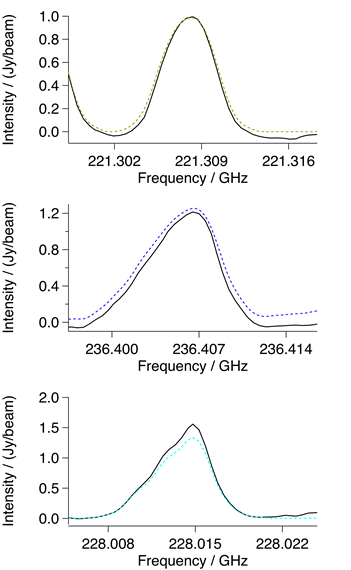
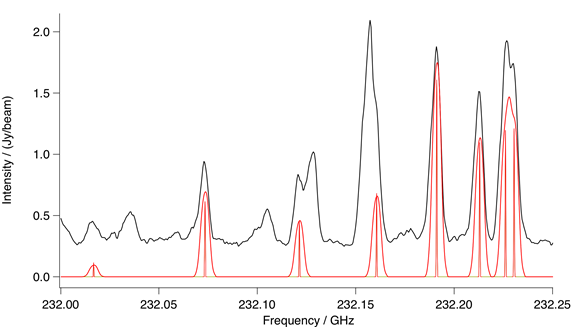
Figure V.B.4.e.3-1. Relatively isolated lines of intermediate strength that were used for the ALMA lineshapes of methyl cyanide, ethyl cyanide, and vinyl cyanide (top to bottom). The solid black traces are the ALMA data and the dashedcolored traces are the convolution of the simulated lineshape with the CES. |
Methyl cyanide has a strong spectrum that in a number of places is relatively unobscured by overlapping lines. A number of its lines are also optically thick. It was possible to match many strong features of both the ground state and v8 = 1 vibrational states in ALMA with an LTE simulation at 190 K. Figures V.B.4.e.3-2 and V.B.4.e.3-3 show the excellent agreement between the ALMA data and the simulation, to include blends, overlaps, and shoulders. The agreement is easiest seen in the v8 = 1 spectrum of Fig. V.B.4.e-3 where the line emission is largely compact and optically thin.
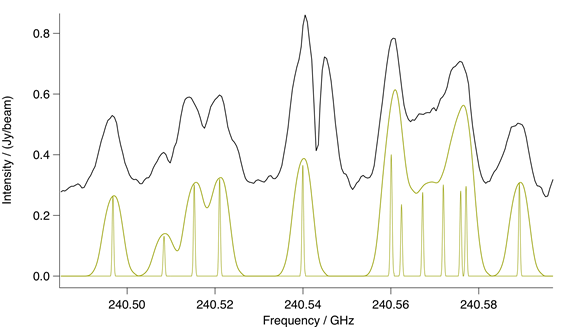
Although the lines in the v8 = 2 vibrational state shown in Fig. V.B.4.e.2-4 are not contained in the current catalogs, we infer their assignment from their location relative to the ground and v8 = 1 vibrational states and their intensity. Additionally, since our analysis returns the lower state energy of each line, we observe a correct vibrational energy for this band. Figure. V.B.4.e.2-4 shows the comparison between the observed and simulated spectra. We presume that the significantly stronger (and broader) ALMA feature near 240.54 GHz (which shows a shoulder) includes a contribution from an overlapping line. Taken together we see that the intensities of the ground and two excited vibrational states show that LTE or near LTE describes at least these vibrational states, along with the rotational states.
It is well known that the interstellar isotopic abundances differ from the terrestrial abundances, but that care needs to be taken to include the impact of optical thickness. Figures V.B.4.e.2-5 (13C on the methyl group) and V.B.4.e.2-6 (13C on the cyanogen group) show comparisons between the ALMA spectrum and simulations. However, since the CES is based on terrestrial abundances, the strength of the laboratory spectrum was increase by a factor of 2.5 to optimize the match on the less overlapped spectrum from the 13C on the methyl group. While the ratio for the spectrum due to the 13C on the cyanogen group may be different, the overlaps are such that an independent adjustment was not merited.
More inclusively, the intensities of all of the lines simulated from the CES for methyl cyanide and that are not overlapped by interfering spectra are consistent with this simple model for the interpretation of the ALMA data. It will be interesting to see if deviations from this simple single temperature LTE model occur as both the ALMA and the spectroscopic analysis are refined and expanded to include more species simultaneously.
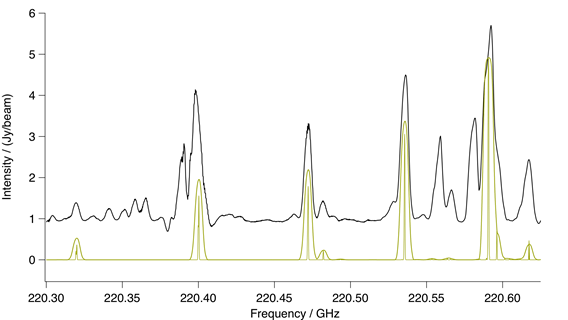 |
Figure V.B.4.e.3-2. Spectral comparison in the region of a methyl cyanide ground vibrational state bandhead. The upper black trace is ALMA and the lower gold trace a CES LTE simulation at 190 K, including effects of optical thickness. Also in gold is a stick spectrum that shows methyl cyanide at laboratory resolution. |
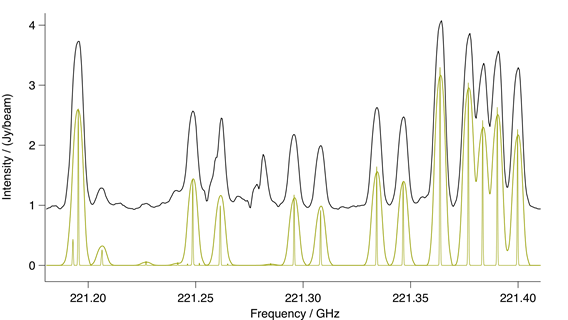 |
Figure V.B.4.e.3-3. Spectral comparison in the region of a methyl cyanide v8 = 1 bandhead. The upper black trace is ALMA and the lower gold trace a CES LTE simulation at 190 K, including effects of optical thickness. Also in gold is a stick spectrum that shows methyl cyanide at laboratory resolution. |
|
Figure V.B.4.e.3-4. Spectral comparison in the region of a methyl cyanide n8 = 2 bandhead. The upper black trace is ALMA and the lower gold trace a CES LTE simulation at 190 K. Also in gold is a stick spectrum that shows methyl cyanide at laboratory resolution. |
|
| Figure V.B.4.e.3-5. Spectral comparison in the region of a methyl cyanide ground vibrational state, 13C methyl group bandhead. The upper black trace is ALMA and the lower red trace a CES LTE simulation at 190 K. Also in red is a stick spectrum that shows methyl cyanide at laboratory resolution. To account for the differences in interstellar and terrestrial abundances, the intensity of the simulation has been increased by a factor of 2.5 |
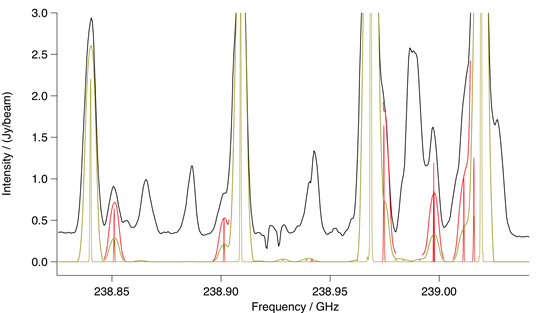 |
Figure V.B.4.e.3-6. Spectral comparison in the region of a methyl cyanide ground vibrational state, 13C cyanide group bandhead. The upper black trace is ALMA and the solid lower red trace a CES LTE simulation at 190 K. Also in red is a stick spectrum that shows methyl cyanide at laboratory resolution. The dashed gold trace is from the 12C simulation of Figs. 4 and 5. To account for the differences in interstellar and terrestrial abundances, the intensity of the 13C simulation has been increased by a factor of 2.5. |
Back to V.B.4.e.3. Spectral Comparisons