V.C.1 The Physics and Spectroscopy of the SMM/THz
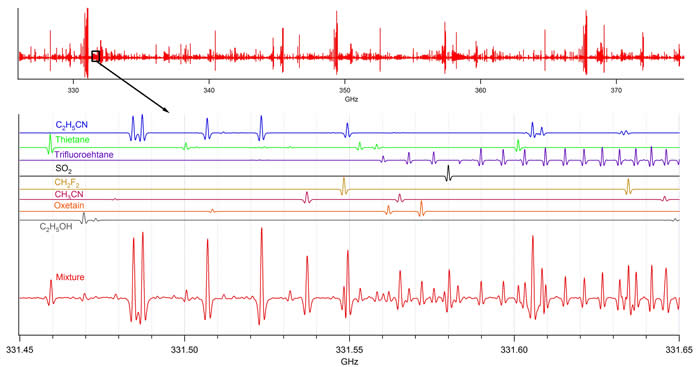
To illustrate the rotational fingerprint, Fig. V.C.1-1 shows a Doppler-limited rotational spectrum recorded with a BWO (Backward Wave Oscillator) based FASSST (FAst Scan Submillimeter Spectroscopy Technique) system [1]. The spectral segment in the bottom panel uses only a small fraction of the available spectral information, shows unambiguous identification of eight of the species in the mixture, and required only about 10 ms to acquire.
Figure V.C.1-1. 50 GHz of a spectrum of a mixture of 20 gases on a highly compressed scale taken with a FASSST BWO based system (top). 0.4% of this spectrum is expanded to show individual lines (bottom). Comparison with the library spectra of eight gases shows their presence in the gas mixture (middle).
A similar spectrum in the 210 – 270 GHz region, shown in Fig. V.C.1-2, was made with a more compact solid-state sensor system.
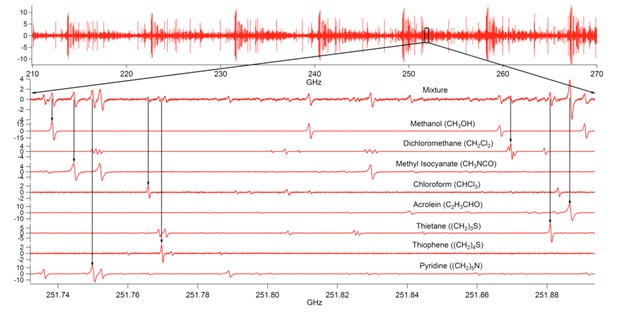
Figure V.C.1-2. The spectrum of a mixture of 14 gases in the region 210 -270 GHz on a compressed scale (upper panel). The spectrum of a 0.15 GHz segment of this mixture (second panel). The library spectra of 8 of these gases (panels three through 10).