Stellar Line Formation
By Yuan-Sen Ting (Harvard University). May, 2013.
"For some, who are travelers, the stars are guides. For others they are no more than little lights in the sky. For others, who are scholars, they are problems." -- The Little Prince
Introduction
Astrophysics is the study of the Universe. The Universe is made up of trillions of galaxies, and each galaxy contains as many as a few hundred billion stars. To understand the Universe, it is necessary to study its building blocks, in the same way one studies atoms to understand the properties of a material. In the case of the Universe, these building blocks are the innumerable stars and the gas betweem them. This website provides an introduction to how astronomers use the light from distant stars and galaxies to understand the properties of the stars and gas in the Universe.
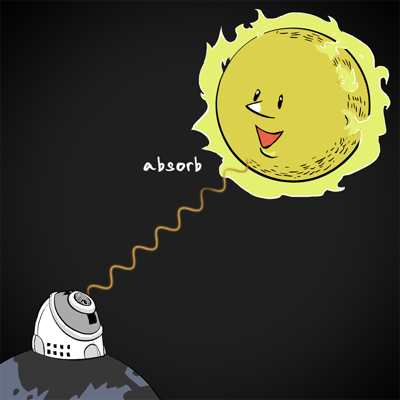
In the first part of this webpage, we are going to study how properties of stars and gas can be measured by taking spectra of the light. The light produced in a star has a long journey before it reaches us. It first passes through the star's atmosphere, then through the gas that occupies the vast space between the star and our telescope and some of the light can be absorbed along the way. To understand why and how this absorption works, one must appeal to the fundamentals of quantum theory that were developed in the early 20th century by Albert Einstein, Niels Bohr and many other leading scientists. Quantum theory tells us that each element, be it hydrogen, helium, carbon, or otherwise, will only absorb particular wavelengths of light corresponding to the way the electrons in the atoms of that element are configured. Therefore, each element will leave a unique finger-print on the stellar light, visible as an absorption feature in the spectrum. By measuring the wavelengths at which these features appear, one can estimate what elements are present in the stars and gas that is responsible for the absorption.
Measuring the density of the gas
The interactive module demonstrates the appearance of spectral absorption features for a variety of elements, which can be selected from the dropdown menu. As mentioned above, each element has a set of characteristic wavelengths at which it can absorb. Thus by studying spectra, astrophysicists are able to know what elements are present in the stars and gas. For instance, the neutral Helium (He I) line will provide us information on neutral Helium and, similarly, He II will inform us on the singly ionized Helium. More importantly, the quantity of the element in the stars or intervening gas (more precisely the column density) will affect how much light can be absorbed; the more atoms present, the more absorption is possible. The column density slider in the interactive module allows one to get a sense of how increasing density can deepen the absorption line. Therefore, not only can we know what elements are present in the stars from their spectra, astrophysicists can also know how much of each element is present in different star!
To better understand what these lines are actually telling us, let us define column density more carefully. When we look at the sky, we only have a two-dimensional view of the Universe; the third dimension -- depth, or distance -- is completely lost. Therefore unless we have other hints that could give us information about the depth, measuring the amount of material from an absorption line gives us the total sum of all the "stuff" along the line of sight, with no information about where along that line of sight the stuff is located. To visualize this more clearly, point your finger at a star somewhere in the sky. Between your finger and the star is a lot of empty space, some of which contains gas that might absorb some of the star's light. Measuring the spectrum of that star only tells you the total absorption from everything between you and it, and not at what distance any given gas cloud is. In mathematical terms, the column density is the volume density integrated along the line of sight.
Measuring the temperature of the gas
As well allowing us to measure the column density, spectra also let us measure the broadening of the lines. The amount of broadening is connected to the internal motion of the gas doing the absorbing, and the degree of motion is related to the gas temperature. Therefore measuring broadening lets us measure the temperature of the gas absorbing the light, whether that gas is in the star's atmosphere or in between the star and us.
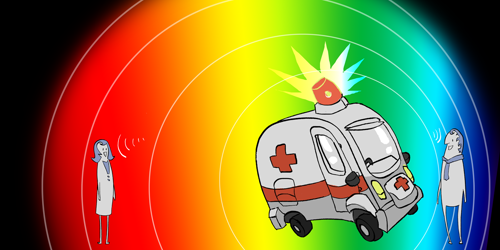
In order to understand how broadening works in detail, let's review the phenomenon known as the Doppler effect, which affects both light and sound waves. As illustrated in the figure, when an ambulance approaches us, we will hear a higher frequency siren (unpleasant!). This is because the sound wave appears to be compressed when the ambulance is moving toward us. We call this Doppler blueshift effect (because a blue electromagnetic wave has a higher frequency [shorter wavelength] than a red electromagnetic wave). Similarly, when the ambulance is moving away from us, we hear a lower frequency pitch for the siren. We call this Doppler redshift. These blueshift and redshift effects are relevant to all astrophysics observations. They give us a handle on how things are moving relative to us even if we might not see the movement directly.
As an analog, consider a car moving away from a person along his/her line of sight. One might not directly see that the car is receding if the car's movement is not terribly drastic. However, if the car is emitting sound, one can study whether the sound waves are compressed or decompressed to know exactly whether the car is moving toward or away! Of course, we can only do this if we have sufficiently sensitive detectors. Luckily, with the technology available today, astronomical detectors are ridiculously sensitive -- think of watching a fly at San Diego from New York!
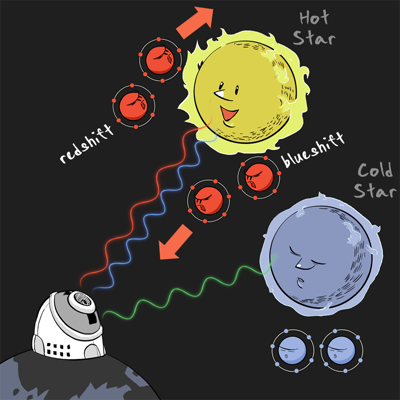
Now, in hotter gas, the atoms are moving much more vigorously compared to those in cooler gas. In other words, in a gas at a high temperature, atoms are moving quickly in all directions. Therefore, there are atoms moving quickly both away or toward us (in addition to moving in other directions). From the Doppler effect, the absorption lines due to these atoms will have both stronger blueshifted (from those moving quickly towards us) and redshifted (from those moving quickly away from us) components compared to a cooler gas's absorption lines. As a consequence, the absorption lines due to hotter gas will appear to be broader than those in cooler gas. This is incredibly useful! It tells us that, by separating the light with different wavelengths and studying the spectrum of the star alone, not only we can know the elements' abundances, we can also know the temperature of the stars or gas!
The equivalent width and the curve of growth
However, the previous discussion has an important caveat-- we need very high-resolution spectra in order to actually see the effects of broadening on the line. In this case, we can look at the detailed shape of the line itself and estimate both the column density and the broadening. However if the spectrum is low resolution, we might not be able to see the detailed line shape and instead can just measure how much light has been blocked out in total. This is called the equivalent width and it depends jointly on the column density and the broadening. The way the equivalent width changes as column density increases is known as the curve of growth. You might want to play with the density slider and see how different column density and Doppler width will trace out the curve of growth.