Stellar Line Formation
By Steven R. Cranmer (Harvard University). May, 2013.
Edit by Yuan-Sen Ting (Harvard University).
A simple, but instructive, way to think about the formation of spectral lines is the Schuster (1905) reversing layer model (see also Mihalas 1978, 1999). The spectral line (i.e., a particular transition from one bound electron energy level in an element to another energy level) is assumed to be formed in a "cloud" of gas sitting "above" the main source of radiation. That main part -- which has tranditionally been thought of as a dense stellar photosphere, but can be any other background radiation source -- is assumed to produce a broad spectral continuum. We also assume that the properties of the line-absorbing (or line-emitting) gas are constant throughout the cloud. If the thickness of the cloud is given by \(\Delta z\), then the dimensionless optical depth in the cloud can be written \begin{equation} \tau_\nu = \kappa_\nu \rho \Delta z = \kappa_{\mathrm{\small L}} \phi (\nu) \rho \Delta z , \end{equation} where \(\nu\) is the photon frequency, \(\kappa_\nu\) is the absorption coefficient in units of cross section per unit mass (e.g., cm\(^2\) g\(^{-1}\)), and \(\rho\) is the mass density. For convenience, we write the absorption coefficient as \(\kappa_\mathrm{\small L} \phi (\nu)\), which separates the total line opacity \(\kappa_\mathrm{\small L}\) from the line broadening coefficient \(\phi(\nu)\).
The solution for the specific intensity \(I_\nu\) that emerges from the Schuster cloud is given by \begin{equation} I_\nu = I_{0\nu} e^{-\tau_\nu} + S_\nu ( 1- e^{-\tau_\nu}) , \end{equation} where \(I_{0\nu}\) is the intensity of the continuum that enters the cloud from below and \(S_\nu\) is the so-called source function of the cloud; it takes account of the local properties of the cloud that would make it "glows" on its own, even in the absence of an external source of radiation. We can continue to make simplifying approximations about these two intensity parameters, and in many cases it is useful to think about them as blackbody Planck spectra. Thus, let us use the shorthand \begin{equation} I_{0 \nu} \simeq B_{\mathrm{\small C}} ( T_{\mathrm{\small C}} ), \qquad S_\nu \simeq B_{\mathrm{\small L}} ( T_{\mathrm{\small L}}), \end{equation} where the subscript "C" denotes the conditions in the background medium where the continuum is formed, and "L" denotes the conditions in the Schuster cloud where the line is formed. In local thermodynamic equilibrium, \(B\propto T^4\), so we can rewrite equation (2) in terms of the dimensionless residual intensity \(r_\nu\) as \begin{equation} r_\nu = \frac{I_\nu}{I_{0\nu}} = e^{-\tau_\nu} + \bigg(\frac{T_{\mathrm{\small L}}}{T_\mathrm{\small C}}\bigg)^4 (1- e^{-\tau_\nu}). \end{equation} One can see that if the temperature in the cloud is lower than the temperature in the underlying continuum photosphere (i.e., \(T_{\mathrm{\small L}}/T_{\mathrm{\small C}} < 1\)) that \(r_\nu <1\) and we will have an absorption line. Conversely, if the cloud is hotter than the underlying continuum region, we will have an emission line with \(r_\nu >1\). Weak, optically thin lines, with \(r_\nu \ll 1\) for all frequencies, have a residual intensity that simplifies to \begin{equation} r_\nu \simeq 1 + \bigg[ \bigg(\frac{T_\mathrm{\small L}}{T_\mathrm{\small C}} \bigg)^4 - 1 \bigg] \tau_\nu. \end{equation} In the cores of strong lines, where \(\tau_\nu \gg 1\), the line is saturated, with \begin{equation} r_\nu \simeq \bigg(\frac{T_\mathrm{\small L}}{T_\mathrm{\small C}}\bigg)^4, \end{equation} and cold absorbing layers (\(T_{\mathrm{\small L}}/T_{\mathrm{\small C}} \ll 1\)) produce saturated absorption lines with nearly "black" cores.
We characterize a line's total amount of absorption or emission by integrating over frequency. Thus, we define the equivalent width \begin{equation} W_\nu = \int \mathrm{d}\nu \; (1- r_\nu). \end{equation} Note that in this case the subscript \(\nu\) does not mean that \(W_\nu\) is a function of \(\nu\), but it is there to convey that this quantity has units of frequency (as opposed to the wavelength version of equivalent width, \(W_\lambda\)). For the standard case of a cold cloud that produces an absorption line, we see that as the number of atoms (hence the column density) in the line-forming cloud increases, the line gets deeper, and the (positive definite) equivalent width grows in magnitude. The dependence of \(W_\nu\) on the total line opacity (measured by some combination of \(\kappa_{\mathrm{\small L}}\) and \(\rho\)) is known as the curve of growth, and its shape allows us to diagnose many useful details about the line-forming region.
Line broadening processes
The shape of the curve of growth depends crucially on the line broadening function \(\phi(\nu)\). The simplest possible picture of atomic transitions assumes that the two energy levels -- let us label the lower level 1 and the upper level 2 -- have precisely known energies \(E_1\) and \(E_2\). Thus, the transition occurs only when photons of a single frequency \(\nu_{\small 12}\) are involved, with \begin{equation} E_2 - E_1 = h \nu_{\small 12} \end{equation} where \(h\) is the Planck's constant. We know this is an idealization of the true quantum mechanical processes going on in bound atomic electron clouds, but for now let us assume it to be the case. In this case, for observers sitting in the rest frame of the atom that is emitting or absorbing a line photon, there is no line broadening at all. This observer will see only line photons at a single frequency that we will call \(\nu_{\mathrm{\small obs}}\). The profile function is a Dirac delta function, \begin{equation} \phi(\nu_{\mathrm{\small obs}}) = \delta ( \nu_{\mathrm{\small obs}} - \nu_{\small 12} ) \end{equation} that is equal to zero for all \(\nu_{\mathrm{obs}} \neq \nu_{\small 12}\). Note that, by convention, \(\phi(\nu)\) has units of 1/frequency, or Hz-1.
However, in a cloud of gas with a finite temperature, the individual atoms are all moving around with random velocities in 3D space. In kinetic theory we describe the microscopic motions of the atoms with a distribution function \(f\) written as a function of the particle vector momentum \(\mathbf{p}\). In most "well-behaved" systems this function is a Maxwell-Boltzmann distribution, \begin{equation} f(\mathbf{p}) = \frac{n}{(2\pi mkT)^{3/2}} \exp \bigg( - \frac{p^2}{2 m kT} \bigg) \end{equation} where \(m\) is the particle mass, \(n=\rho/m\) is the number density, \(k\) is the Boltzmann's constant, \(T\) is the temperature, and for non-relativistic speeds, \(p^2 = m^2 (v_x^2 + v_y^2 +v_z^2)\). If we assume that this cloud is randomly moving atoms is being viewed by a stationary observer, along a line-of-sight that is parallel to, say, the \(x\)-axis, then whenever \(v_x \neq 0\), each atom that emits a photon with frequency \(\nu_{\small 12}\) in its local rest frame will give rise to a photon that is slightly Doppler shifted in the observer's frame. This Doppler effect produces a shifted line profile function, \begin{equation} \phi (\nu_{\mathrm{\small obs}}) = \delta \bigg( \nu_{\mathrm{\small obs}} - \nu_{\small 12} + \frac{\nu_{\small 12} v_x}{c} \bigg) \end{equation} where we define \(v_x > 0\) as motion away from the observer and \(v_x < 0\) as motion toward the observer.
Equation (11) is valid for a single atom that has a projected velocity of \(v_x\) in the observer's line-of-sight direction. However, we would like to average over the entire velocity distribution to obtain a mean line profile function for the absorbing medium. Thus, we define \begin{equation} \langle \phi (\nu_{\mathrm{\small obs}}) \rangle = \frac{\int \mathrm{d}^3 \mathbf{p}\, f(\mathbf{p}) \phi (\nu_{\mathrm{\small obs}})}{\int \mathrm{d}^3 \mathbf{p}\, f(\mathbf{p}) } \end{equation} For the Maxwellian distribution, the denominator in the above integral is just the number density \(n\). The numerator is slightly more complicated to evaluate, but one can separate the exponential in \(f(\mathbf{p})\) into multiplicative terms that are function of only \(v_x\), \(v_y\), and \(v_z\), so the integrals in all three dimensions of "momentum space" can be done separately. The \(v_y\) and \(v_z\) integrals can be reduced to standard definite integrals over a Gaussian function that can be looked up. The \(v_x\) integral involves the Dirac delta function, whose argument must be transformed from frequency units to momentum units. The details can be found in several radiative transfer textbooks, and the results is \begin{equation} \langle \phi (\nu_{\mathrm{\small obs}}) \rangle = \frac{1}{\Delta \nu_{\mathrm{\small D}}\sqrt{\pi}} e^{-x^2} \end{equation} where we define the dimensionless line frequency \(x\) and the Doppler width \(\Delta \nu_{\mathrm{\small D}}\) as \begin{equation} x = \frac{\nu_{\mathrm{\small obs}}- \nu_{\mathrm{\small 12}}}{\Delta \nu_{\mathrm{\small D}}}, \qquad \Delta v_{\mathrm{\small D}} = \frac{\nu_{\small 12}}{c} \sqrt{\frac{2kT}{m}}. \end{equation} Equation (13) gives the line profile function for pure Doppler broadening.
Above, it was mentioned that the Dirac delta function form of the atomic rest-frame profile function was just an idealization. In reality, there are several effects that can make the atomic energy levels "fuzzy". First, there is just the Heisenberg uncertainty principle, which limits our knowledge of the energy of a state that has a finite lifetime. Recall that one form of the uncertainty principle is \begin{equation} \Delta E \Delta t \sim h \end{equation} where for a photon, an uncertainty in its energy means that there is an uncertainty in its frequency, \(\Delta E = h \Delta \nu\). If the excited state only lives for a finite lifetime \(\Delta t = 1 / \gamma\), then we know that we cannot know the photon's frequency to better than an uncertainty given by \(\Delta \nu \simeq \gamma\). One can show that the profile function in atom's rest frame is then "fuzzed out" in frequency, and \(\phi (\nu)\) must be interpreted as a probability distribution of finding the photon at any specific frequency. The uncertainty principle provides a finite width to the profile, and quantum mechanical calculations show that it becomes a so-called Lorentzian function, \begin{equation} \phi (\nu_{\mathrm{\small obs}}) = \frac{\gamma/8 \pi^3}{(\nu_{\mathrm{\small obs}} - \nu_{\small 12} + \nu_{\small 12} v_x /c)^2 + (\gamma/4\pi)^2} \end{equation} which reduces to equation (11) in the limit of \(\gamma \rightarrow 0\).
It should also noted that there are several other physical processes, besides the quantum natural broadening discussed above, that also can give rise to a Lorentzian line profile. One of these is collisional broadening, which takes account of the fact that the gas is not just filled with that one atomic species that is doing the emitting and absorbing. A higher total pressure in the system (especially from free electrons that zip around with high speeds) produces a higher rate of collisions between the emitting atoms and their neighbors. This can enhance the effective value of \(\gamma\) by several orders of magnitude above the natural broadening level.
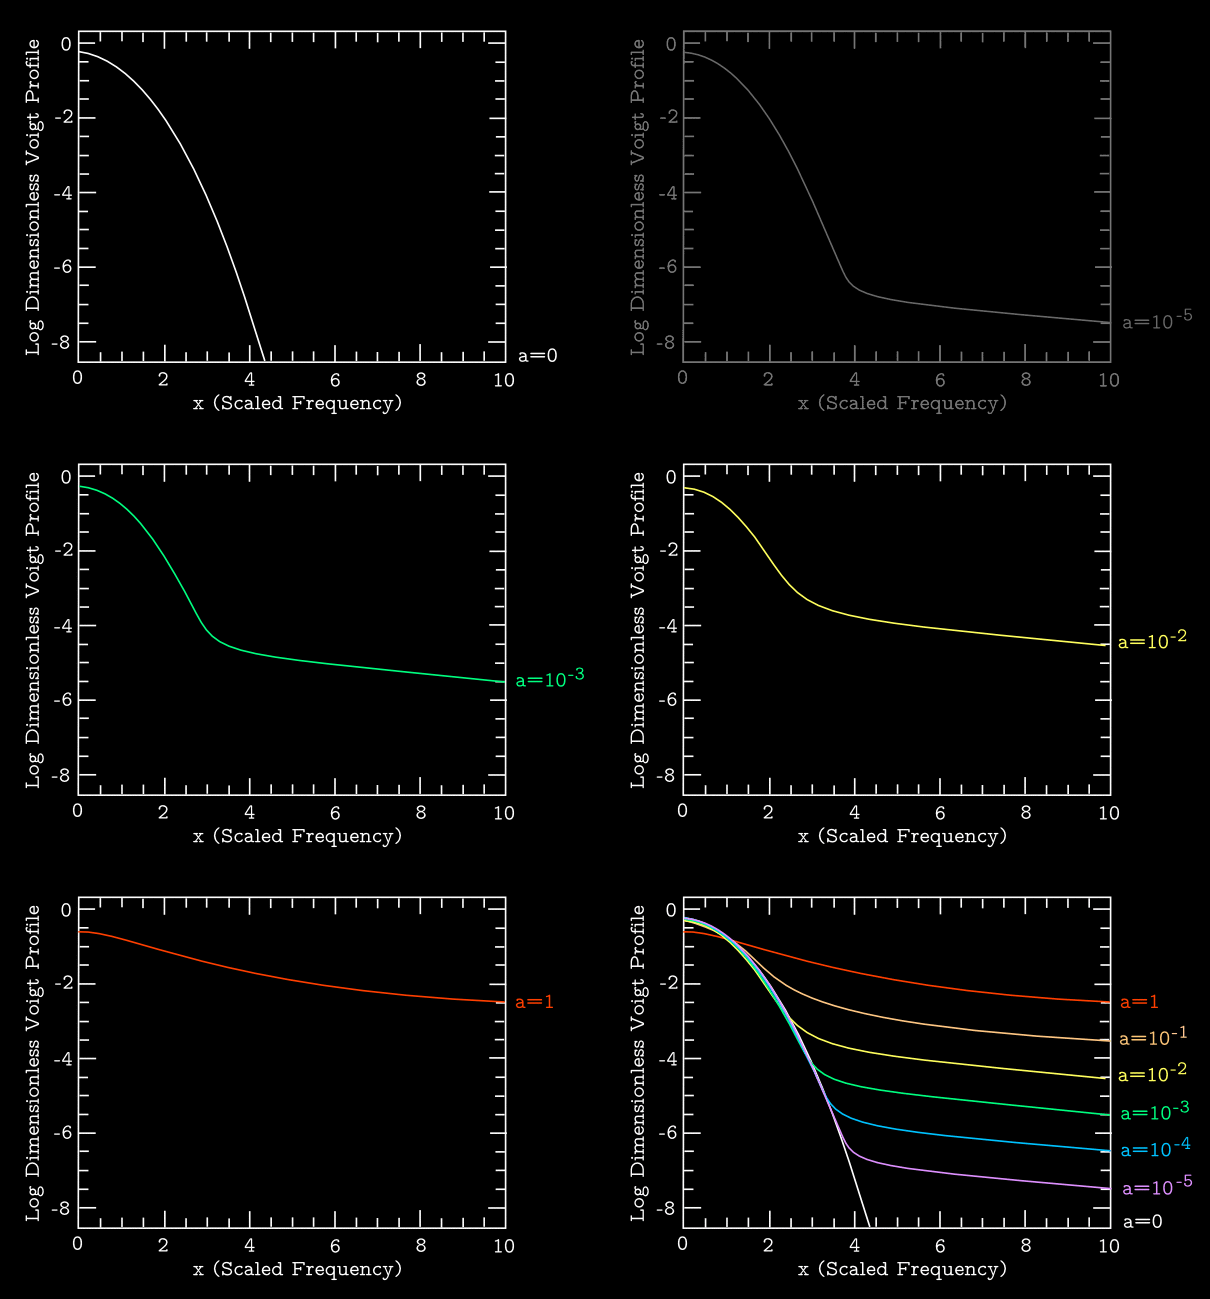
For whatever non-zero value of \(\gamma\) is present in the atom's rest frame, we want to know how it combines with the Maxwell-Boltzmann Doppler broadening discussed above. We must insert the single-atom profile function given in equation (16) into the mean-profile integral of equation (12). Unfortunately, there is no simple closed-form solution to that integral, but astronomers have defined a new two-parameter special function, known as the Voigt function, that encapsulates the difficult integral. The profile is given by \begin{equation} \langle \phi (\nu_{\mathrm{\small obs}}) \rangle = \frac{\widetilde{H}(a,x)}{\Delta \nu_{\mathrm{\small D}}} \end{equation} and the normalized version of the Voigt function is defined as \begin{equation} \widetilde{H}(a,x) = \frac{a}{\pi^{3/2}}\int^{+\infty}_{-\infty} \frac{\mathrm{d}y \, e^{-y^2}}{(x-y)^2 + a^2} \end{equation} Algorithms for computing the Voigt profile have been described by, e.g., Armstrong (1967), Letchworth & Benner (2007), and many others. Above, \(x\) and \(\Delta \nu_{\mathrm{\small D}}\) have the same meanings they did for Doppler broadening, and the dimensionless "damping constant " \(a= \gamma/(4\pi \Delta \nu_{\mathrm{\small D}})\) is a ratio that conveys the relative importance of the two sources of line broadening. When \(a \ll 1\), the profile is mostly Doppler broadened and Gaussian. When \(a \gg 1\), the profile is mostly Lorentzian. Note that \(\widetilde H(0,x) = e^{-x^2}/\sqrt{\pi}\), so that equation (17) agrees with equation (13) in the limit of \(a \rightarrow 0\).
Figure 1 shows several Voigt profiles for a set of example values of \(a\), and compares them to the Gaussian function limit of \(a=0\). These plots show the dimensionless profiles given by \(\Delta \nu_{\mathrm{\small D}} \langle \phi \rangle\). Note that these profiles are defined such that \begin{equation} \int \mathrm{d}\nu \, \langle \phi \rangle = 1 \end{equation}
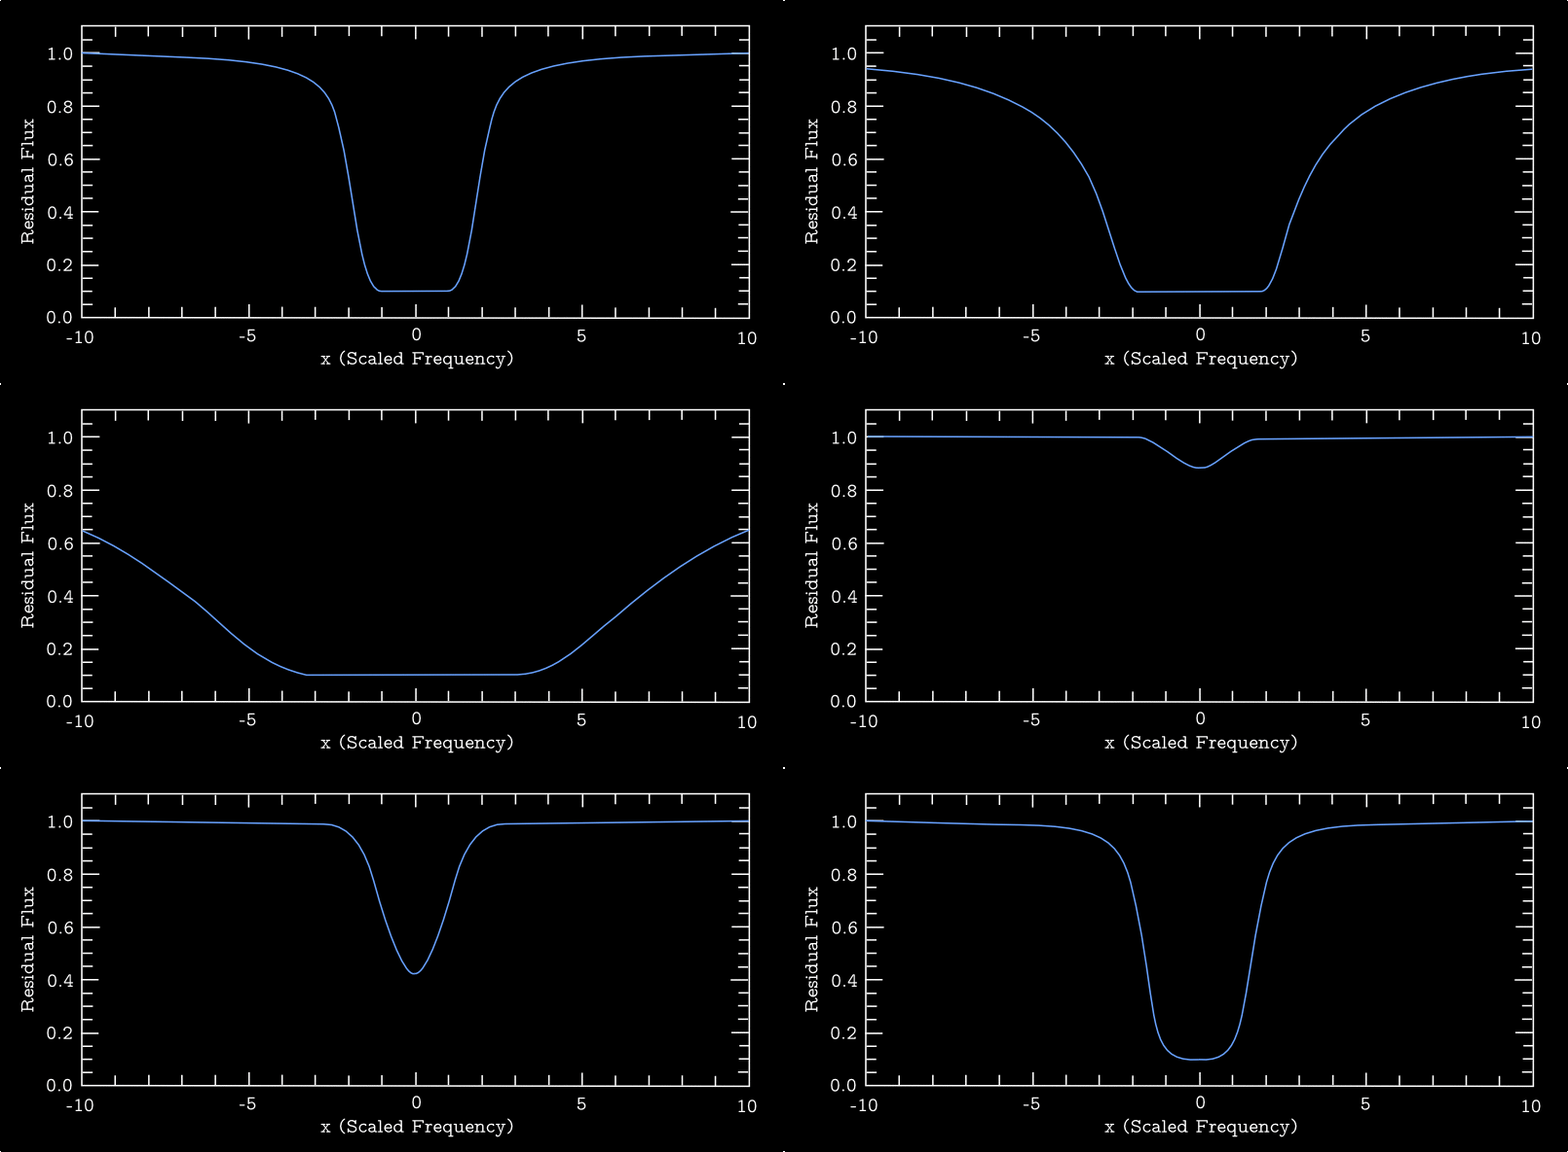
Also, Figure 2 shows a set of residual line profiles \(r_\nu\) as a function of \(x\), all having Voigt profiles with \(a=0.1\) and computed for a range of optical depth normalization parameters \(\tau_0\) (see below for definition).
Evaluating the curve of growth
Finally, we want to evaluate the shape of the curve of growth \(W_\nu\) as a function of total line opacity. Let us redefine the total opacity by writing the optical depth as \begin{equation} \tau_\nu = (\kappa_{\mathrm{\small L}} \rho \Delta z) \phi (\nu) = (\tau_0 \Delta \nu_{\mathrm{\small D}} \sqrt{\pi} ) \phi(\nu) \end{equation}
Let us evaluate the equivalent width \(W_\nu\) using equation (5) and (7). In general, \begin{equation} W_\nu = W_0 \int \mathrm{d}\nu \, (1 - e^{-\tau_\nu}) \end{equation} where we also define \begin{equation} W_0 = 1 - \bigg( \frac{T_{\mathrm{\small L}}}{T_{\mathrm{\small C}}} \bigg)^4 \end{equation} to scale out the environmental effects of the layer and background. In the limit of a very weak line (\(\tau_\nu \ll 1\)), the integral becomes \begin{equation} W_\nu = (\tau_0 \Delta \nu_D \sqrt{\pi}) W_0 \int \mathrm{d}\nu \, \phi (\nu) \end{equation} As was noted above, the profile functions are defined to be normalized over frequency, so the integral of \(\phi(\nu)\) over \(\mathrm{d}\nu\) is equal to 1. Thus, weak lines exhibits \(\mathrm{W}_\nu \propto \tau_0\) and are said to be in the linear part of the curve of growth.
For a line that is reasonably strong (i.e., optically thick) in its Doppler core, but still not showing much absorption in its Voigt wings, we can use equation (13) for the profile function and write the relevant integral as \begin{equation} \int \mathrm{d} \nu \, (1-e^{-\tau_\nu}) = \Delta \nu_{\mathrm{\small D}} \int \mathrm{d} x \, \Big[ 1 - \exp \big( - \tau_0 e^{-x^2} \big) \Big] \end{equation} This expression is difficult to evaluate, but when \(\tau_0 \gg 1\) the core of the line is sufficiently saturated that one can approximate the integrand as \begin{equation} 1 - \exp\big(-\tau_0 e^{-x^2}\big) \simeq \left\{ \begin{array}{ll} 1, & |x| \leq x_{\mathrm{\small half}}, \\ 0, & |x| > x_{\mathrm{\small half}} \end{array} \right. \end{equation} where \begin{equation} x_{\mathrm{\small half}} = \sqrt{\ln \bigg( \frac{\tau_0}{\ln 2} \bigg)} \end{equation} is the dimensionless frequency at which the above function is equal to 0.5. This value effectively defines the boundary between the saturated core and the exponentially damped wings. With this approximation, it becomes much easier to evaluate the integral, and \begin{equation} W_\nu \simeq 2 W_0 \Delta \nu_{\mathrm{\small D}} x_{\mathrm{\small half}} \end{equation} and, since \(\tau_0\) is assumed to be much larger than \(\ln 2\) in this limiting case, we have \(W_\nu \propto \sqrt{\ln \tau_0}\), which is a slowly varying function that is often called the flat part of the curve of growth.
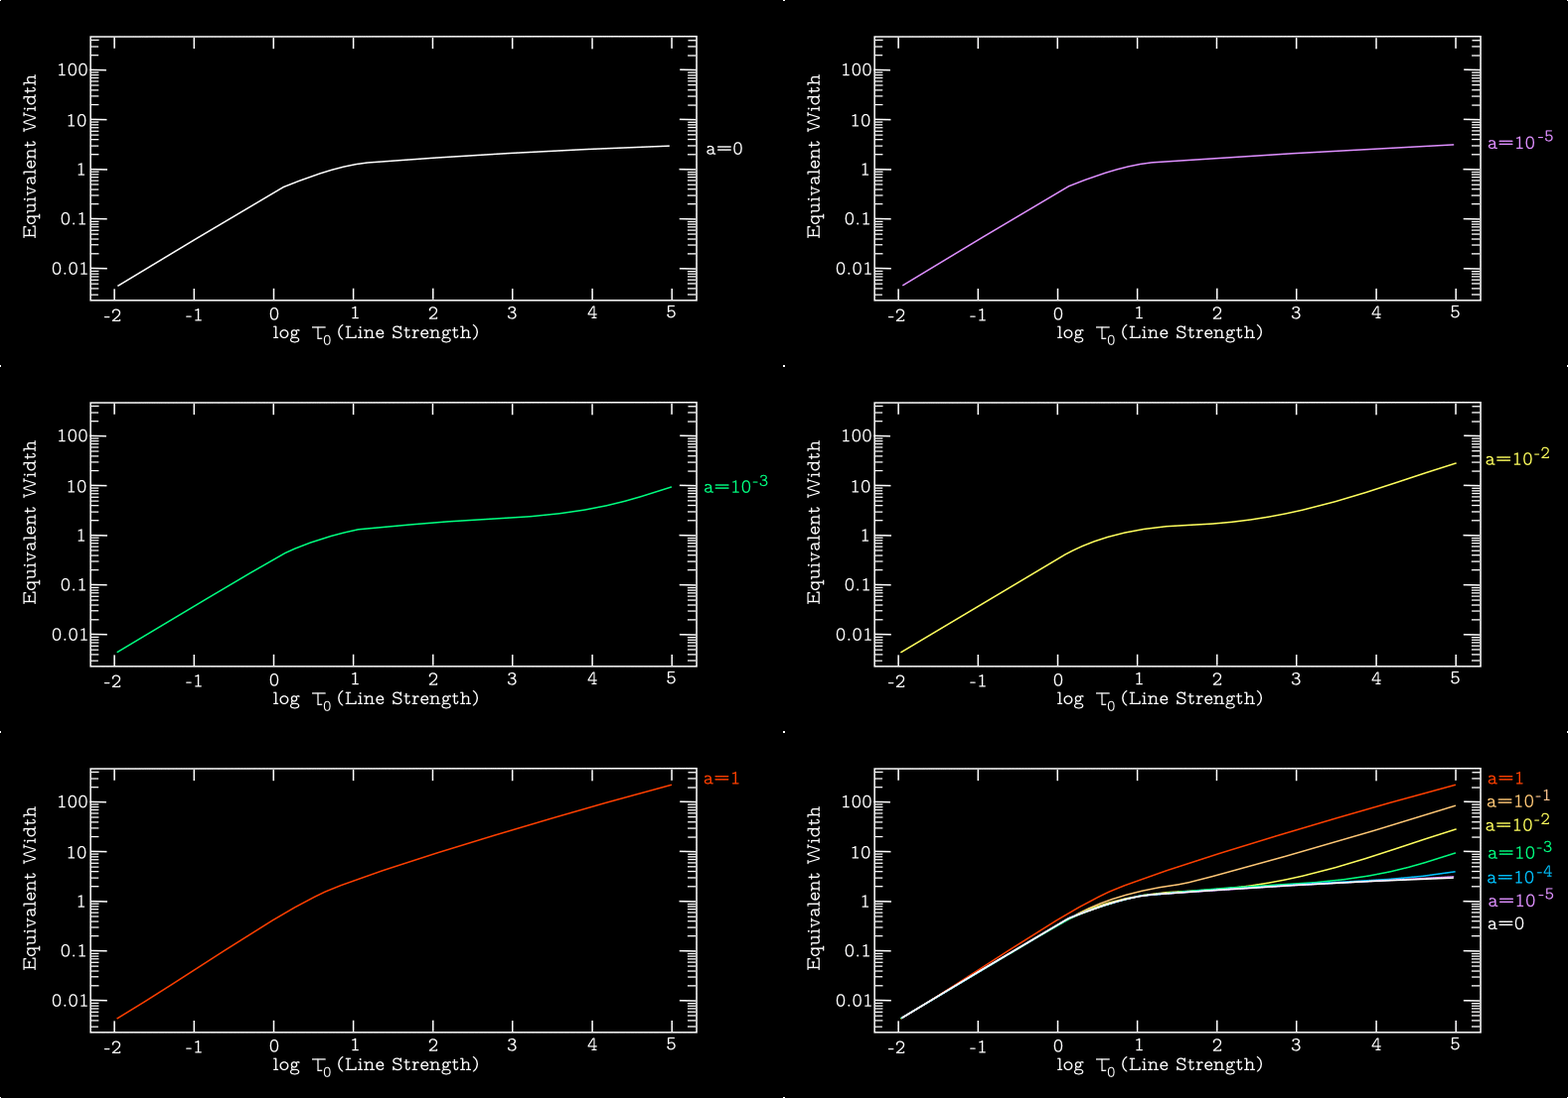
Figure 3 shows the curve of growth for the same set of damping constants \(a\) as were shown in the Figure 1. For \(a \ll 1\) there is a definite flattening with increasing \(\tau_0\), followed by the onset of the square-root behavior due to the Voigt wings. For \(a \gtrsim 1\), however, the curve transitions directly from the weak linear behavior to the strong Voigt-wing square-root behavior.
References
- Armstrong B. H., 1967, J. Quant. Spec. Radiat. Transf., 7, 61
- Letchwork K. L. & Benner D. C., 2007, J. Quant. Spec. Radiat. Transf., 107, 173
- Mihalas D., 1978, Stellar Atmosphere, 2nd ed., W. H. Freeman, San Francisco
- Mihalas D., 1999, ApJ, 525C, 25
- Schuster A., 1905, ApJ, 21, 1


