Skew-Stable Densities

Skew-Stable Distributions

Corrected precisions added 9/26/05.
Up to JHM homepage.
as documented in J. Huston McCulloch and Don B. Panton,
"Precise Tabulation of the
Maximally-Skewed Stable
Distributions and Densities,"
Computational Statistics and Data
Analysis vol. 23 (Jan. 1997), pp. 307-320.
The reader is also referred to Geoff Robinson, "Rapid Computations Concerning Log Maximally-Skewed Stable Distributions, With Potential Use for Pricing Options and Evaluating Portfoio Risk," Sept. 2005, online at http://www.cmis.csiro.au/geoff.robinson/combined.pdf. Robinson confirms, using extended precision (16 byte) calculations, that the probabilities and densities at the estimated fractiles tabulated in the above file have absolute accuracies well within 4.1e-10 and 2.0e-13, respectively, as claimed in the McCulloch and Panton paper. However, he detected four instances in which the relative density error exceeded the 1.6e-12 claimed by McCulloch and Panton. The worst of these, for p = 0.9999 and alpha = 1.0, was 2.6e-10. The latter value should therefore be used as an upper bound on the relative density precisions in the above file, and we are grateful to Robinson for correcting this overstatement in our paper.
The source of our error probably lay in the fact that we were only using standard double precision (8 byte) arithmetic, with the result that rounding errors may have accumulated in excess of the pure quadrature errors that we did attempt to quantify.
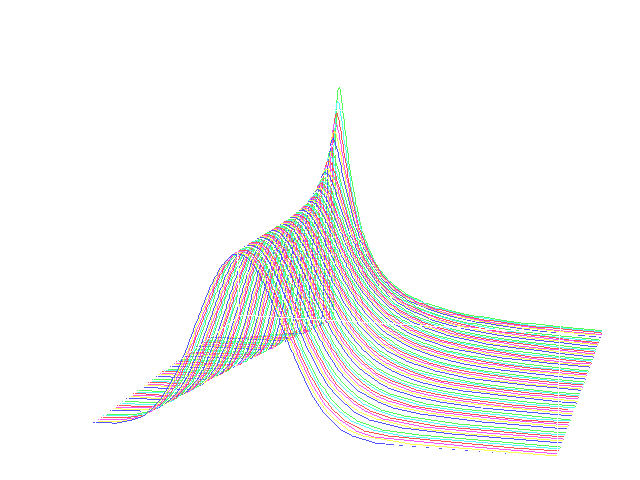
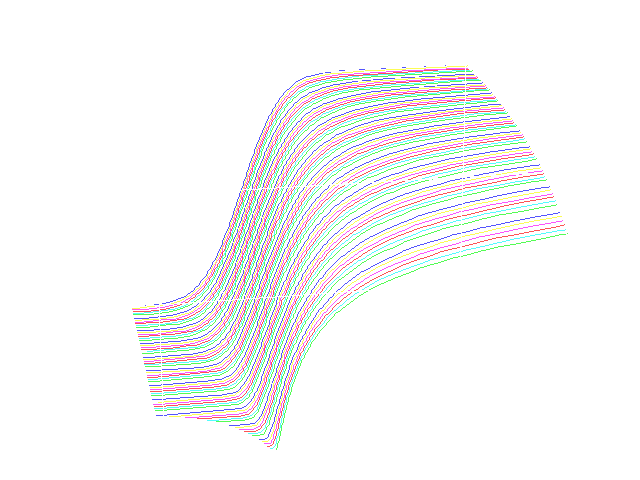
The following graphs are plotted from the data in the above tabulation. "Zeta" = tan(pi*alpha/2)is a shift factor that induces continuity in the plotted surface.

