V.E.2 Active systems
V.E.2 Active Systems
As we have noted elsewhere, 1 mW in a 1 MHz bandwidth corresponds to a brightness temperature of 1014 K, vastly higher than ambient temperatures. Even with broader bandwidth detectors, the illumination temperatures are still high, especially for rapidly scanning systems [1].
However, use of active illumination comes at a price, speckle and other coherent effects [2], which are well known in the optical [3-5]. These can severely degrade image quality, interpretation, and recognition. The lower panel of Fig. V.E.1.b-1 shows an active image of a head [6, 7], which can be compared with the passive image in the upper panel. This active image shows the dominance of specular reflections (the bridge of the forehead and parts of the cheeks) that are perpendicular to the imaging axis), the lack of signals from non-optimally oriented specular features (the rest of the skin of the face), and the dominance of speckle in the beard.
Modulated Mode Mixing to mitigate both speckle and requirements for ‘special’ target orientation:
An avenue of attack on the problems of active imaging (speckle from diffuse targets and the requirement for strategic orientation for specular targets) is provided by the very high brightness temperature of modest illuminator power confined in a narrow bandwidth.
If it is possible not only to illuminate this extended image from many modes/angles and mix the illumination on the time scale of the pixel dwell time, the speckle contrast ratio will be reduced by a factor of N1/2, where N is the number of modes participating in the illumination.
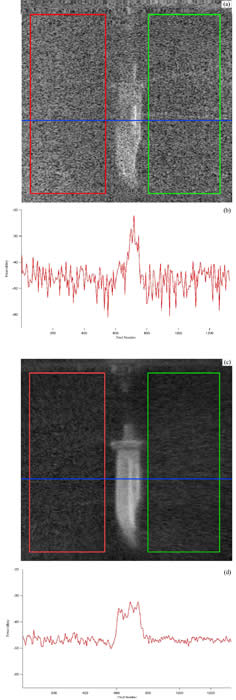
This effect can first be seen by first considering a simple image, a knife covered by a cloth, with the diffuse reflection from the cloth providing a speckle pattern that overlays the image of the knife. Fig. V.E.2.a-1 shows this reduction in coherent speckle that results from its illumination from 16 independent modes.
Figure V.E.2.a.1-1. (a) Image of a knife under a thin brown robe at 632 GHz . (c) Co-added image of a knife taken at 16 independent angles. The quantitative traces below each image show the signal along the blue line in each image. These graphs show that the speckle contrast noise is reduced by (16)1/2 = 4 by the averaging over the 16 independent images.
The atrium of the Physics Department at Ohio State, shown in Fig. V.E.2.a-2, represents a larger (size scale of 50 m) and much more complex image. Even with its ~ 108 modes at 217 GHz, the brightness temperature per mode of the atrium illuminated with a 5 W EIK illuminator is still of the order 1010 K [8].
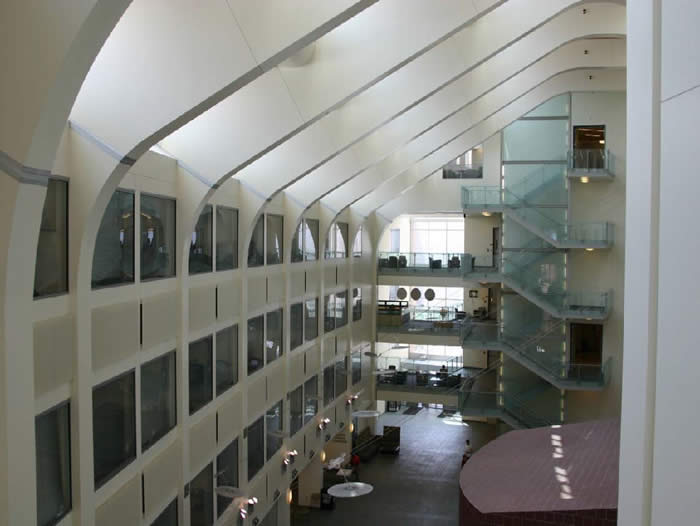
Figure V.E.2.a-2. Optical image of the atrium of the Physics Building at Ohio State University.
Figure V.E.2.a-3 shows its image at 217.8 GHz with and without mode mixing. Section V.E.2.a.i. below provides a more detailed discussion of these results, including quantitative analyses of the speckle statistics within the several colored boxes in these images.
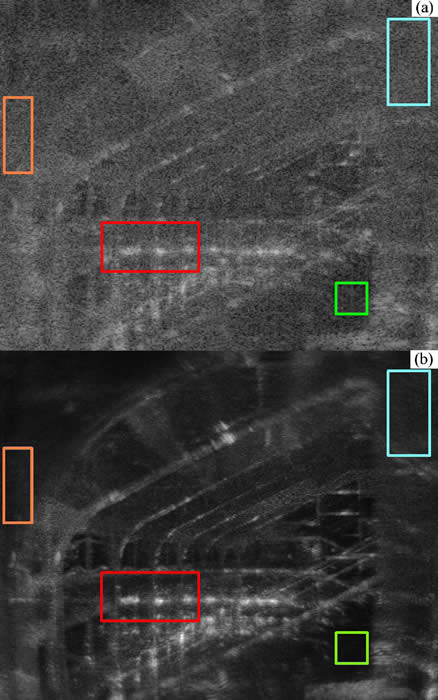
Figure V.E.2.a-3. (a) 218.4 GHz image of the atrium of the Physics Building at Ohio State University with multimode illumination, but without modulated mode-mixing and (b) with modulated mode mixing. The colored boxes show areas for which speckle statistics have been calculated.
V.E.2.a.i Impact of Modulated Mode Mixing on Image Speckle - Additional Detail
The images of Fig. V.E.1.b-1 were obtained with a slow single pixel imager. Although at a fundamental level rapidly scanning single pixel imagers can have a S/N advantage over array based systems (largely because the illuminating power can be focused on the pixel being observed) [1] they are difficult to implement at video frame rates. A successful approach to video frame rate imaging is based on a 120 element microbolometer array. This system is capable of producing signal comparable in strength to the much more elaborate and expensive MMIC amplifier arrays [10].
Most of the work above focused on at least modest stand-off distances (> 1 m) with macroscopic object sizes (≥ 1 m). In addition, many proximate images have been made, often with THz-TDS systems [11]. Proximate imaging is well suited to this technique because it takes advantage of its broad spectral bandwidth and ranging capabilities without being too hindered by the low power and spectral brightness of THz-TDS systems [1].
In a typical experiment the target is placed at the focus of a pair of small f-value off-axis parabaloids that focus the radiation on a small point and collect the transmitted radiation. The sample is then raster scanned to produce an image. A particularly interesting example, perhaps the first made with THz-TDS methods, uses a leaf to show the migration of water as the leaf dries [11]. Backward Wave oscillators have also been used to make proximate images of many objects including leaves, electronic credit cards, objects in envelopes [12].
In a very different application SMM/THz imaging has been used in the study of art and archaeological objects [13] Since many of these objects are layered and have relatively large transmission, this appears be a particularly good application of THz-TDS techniques.
The interest reader is referred to an extensive literature on this subject [14-19].
[2] R. Appleby, R.N. Anderton, Proc. IEEE, 95 (2007) 1683-1690.
[3] J.W. Goodman, Opt. Commun., 14 (1975) 324-327.
[4] J.W. Goodman, J. Opt. Soc. Am., 66 (1976) 1145-1150.
[7] D.T. Petkie, J. Holt, M.A. Patrick, F.C. De Lucia, Opt. Eng., 51 (2012) 091604-091601/091607.
[8] M.A. Patrick, J.A. Holt, C.D. Joye, F.C. De Lucia, J. Opt. Sco. Am B, in press (2012).
[11] B.B. Hu, M.C. Nuss, Opt. Lett., 20 (1995) 1716-1718.
[14] S. Hunsche, M. Koch, I. Brener, M.C. Nuss, Opt. Commun., 150 (1998) 22-26.
[15] Q. Wu, T.D. Hewitt, X.-C. Zhang, Appl. Phys. Lett., 69 (1996) 1026-1028.
[16] X.-C. Zhang, Phys. Med. Bio., 47 (2002) 3667-3677.
[17] W. Lam Chan, J. Deibel, D.M. Mittleman, Rep. Prog. Phys., 70 (2007) 1325-1379.
[18] B. Ferguson, S. Wang, D. Gray, D. Abbott, X.-C. Zhang, Phys. Med. Biol., 47 (2002) 3735-3742.
[19] K. Ajito, Y. Ueno, IEEE Trans. Terahertz Science and Technology, 1 (2011) 293-300.