V.E.2.a.i Impact of Modulated Mode Mixing on Image Speckle
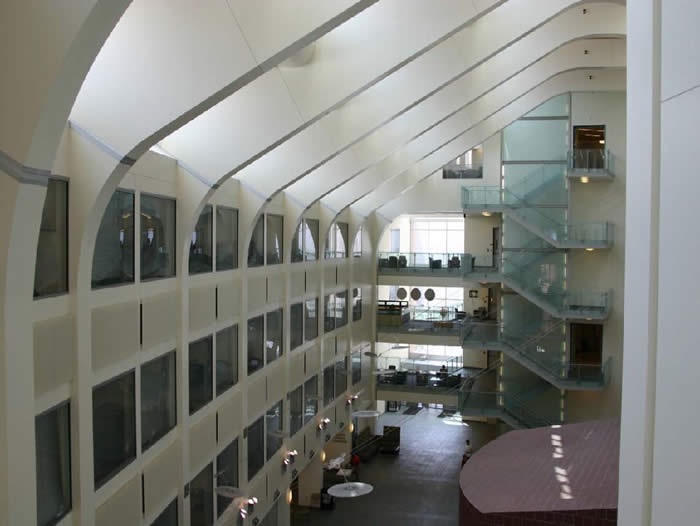
Figure 1 shows an optical image of the atrium of the OSU physics department. This is a considerably larger and more detailed scene than is typically used for demonstrations of millimeter-wave active images. The scale of the atrium is a length of about 50 m, a height of about 20 m and a varying width of 7 – 15 m. The wall on the left is curved. At the far end are open staircases and platforms with glass partitions and railings.
Figure 1. Optical image of the atrium of the Physics Building at Ohio State University.
The upper panel of Figure 2 shows an image of the atrium with multimode illumination, but without modulated mode mixing. Because many modes are illuminated, the requirement for special angular alignment of the target is removed, but substantial speckle remains. The lower panel of Figure 2 shows the same image, but with modulated mode mixing. For this work the illuminator was located on the floor near the right of the atrium, with the direct path of illumination from the transmitter to receiver blocked. For all of the ceiling beams, it can be seen that the bottoms of the beams are more strongly illuminated than their sides. Since many materials have similar diffuse scattering this shadowing is important for image contrast. Similar effects are observed in the optical, for example along the terminator line of the moon illuminated by the sun.
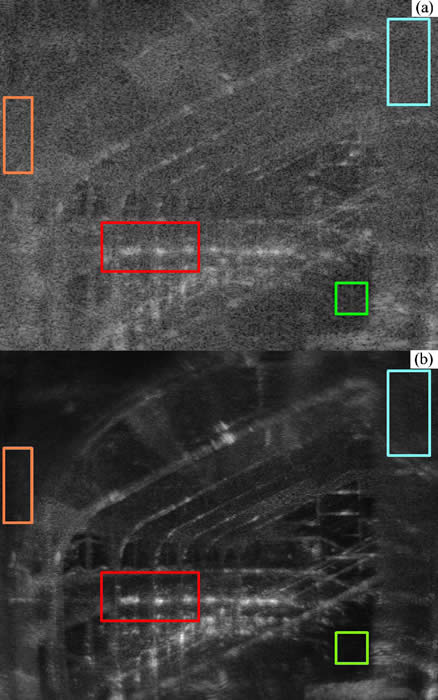
Figure 2. (a) 218.4 GHz image of the atrium of the Physics Building at Ohio State University with multimode illumination, but without modulated mode-mixing and (b) with modulated mode-mixing. The colored boxes show areas for which speckle statistics have been calculated.
A number of prominent features are associated with the open staircase in the far end of the atrium. From front to back are a glass front piece (topped by a metal railing), the up stairs going from right to left, a glass divider between the stairs, the up stairs going from left to right and the drywall of the atrium. While some of these features are observable in the upper panel, many more and additional detail are observable in lower panel of Fig. 2. For example, the supports of the front stairs are clearly visible (as are the turning platforms). The handrails are also observable, but not as clearly. Additionally, lighting for the atrium is provided by the reflection of light from diffuser disks suspended by wires in the volume of the atrium. These wires are more easily visible in the millimeter image than in the optical image, appearing diagonally from the lower left to the middle right portion of the image.
In Fig. 3 it is easy to visually observe the reduction of the speckle contrast because the image contains large uniform areas. It is also possible to show that that speckle noise is reduced by N1/2, where N is the number of independent images in the average. However, in Fig. 2 the speckle size is comparable to the angular size of many of the small features in the atrium, and the evaluation of the speckle reduction requires a more formal approach.
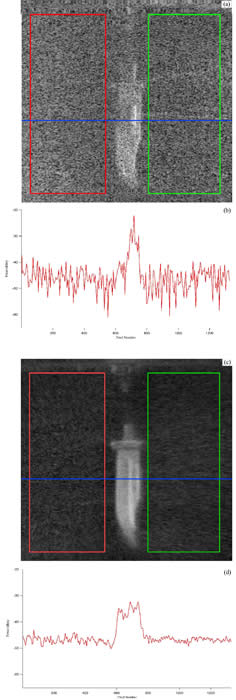
Figure 3. (a) Image of a knife under a thin brown robe at 632 GHz . (c) Co-added image of a knife taken at 16 independent angles as defined by Eq. 15. The quantitative traces below each image show the signal along the blue line in each image. These graphs show that the speckle contrast noise is reduced by (16)1/2 = 4 by the averaging over the 16 independent images.
B.1 Image of a simple object – a knife covered with cloth.
Let us start by using a more formal approach on the images in Fig. 3. Goodman’s criteria for the independence of the speckle patterns [1] also concludes that of the 41 images taken across 410 there are 16 independent illumination angles. An image that is the average of many speckle patterns will have an intensity distribution that follows a gamma density function of order N,
![]() (1)
(1)
B.2 Image of a complex object – the atrium of the OSU Physics Building
The gamma density function of Eq. 1 was first used to analyze the speckle at three areas of the unmodulated image of the Physics atrium shown in the upper panel of Fig. 2. The results are shown in Fig. 4. These areas were selected to have large, nearly uniform structures so that changes in scene geometry and reflectivity did not dominate the speckle statistics. The upper intensity distribution (orange box) is from a nearby wall (at ~10 m) made of painted drywall and returned a fit parameter N = 3.63. The middle intensity distribution (green box) is from a seminar room (at ~ 30 m) that is interior to the atrium and covered with rough tile and returned N = 4.31. The lower intensity distribution from a wall (at ~10 m), made of painted drywall, and returned N = 3.84. Since the contrast is inversely proportional to the square root of the fit parameter N, the average speckle contrast C of each of these images is 0.51.
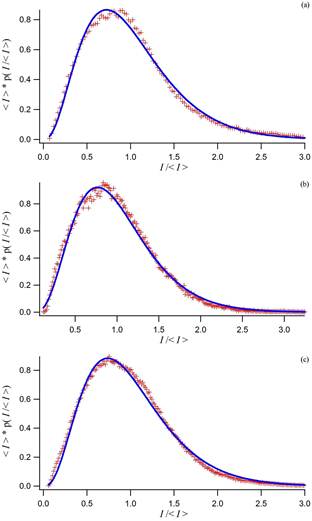
Figure 4. Fits to the Gamma function of Eq. 23 for the image within the (a) orange, (b) green, and (c) blue boxes in Fig. 2.
However, as we have noted above, the images of the physics atrium are complex, not only because of the angular variation that forms the image, but also in the nature and variety of its reflection. For a surface that has a surface roughness that is less than a wavelength, the resulting reflection will be part specular and part diffuse. The resulting signal will not create the “fully developed speckle” pattern of Eq. 1, but will follow a modified Rician density function
 (2)
(2)
where I is the intensity, In is the average speckle intensity, r is the ratio of the specular reflection amplitude to the average speckle intensity, and I0 is the modified Bessel function of order zero. The contrast of the image is
![]() . (2)
. (2)
The same intensity distributions as above were fit to modified Rician density functions after normalizing to the average speckle intensity, shown in Fig. 5, producing values of r = 6.2, 7.5, and 6.6, or an average contrast value of C = 0.49.
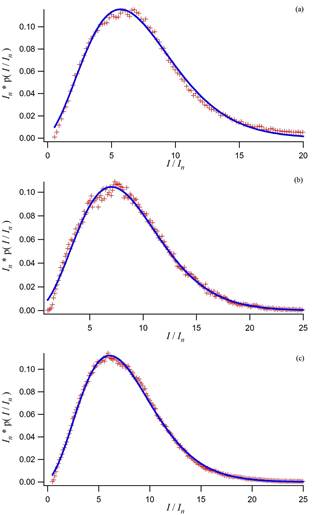
Figure 5. Fits to the Rician function of Eq. 24 for the image within the (a) orange, (b) green, and (c) blue boxes of the upper panel in Fig. 2.
Inspection of the fits in Fig. 4 and 5 show somewhat better fits for the Rician function, especially in the bottom two panels.
B.3 Mode mixed image of a complex object – the atrium of the OSU Physics Building
The image in the lower panel of Fig. 2 was taken with the modulated mode mixing illumination on. The result of the modulation is to average together speckle patterns from many illumination modes, as in the averaged knife picture, without having to make many images. The same three regions of the picture as the unmodulated picture were taken for statistical analysis of the speckle. Fitting the intensity distribution to the gamma density function, shown in Fig. 6, the image in the orange box on the left side of the image returned N = 49.9, in the green box in the lower middle N = 158.0, and in the blue box in the upper right N = 42.5. The average contrast value for all three sections of the picture was C = 0.125, with the speckle pattern in the green box being reduced by nearly a factor of two over the other two regions.
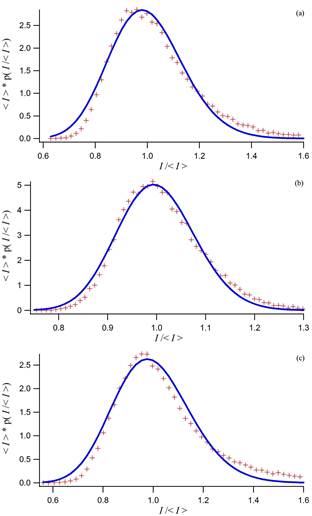
Figure 6. Fits to the Gamma function of Eq. 23 for the averaged image within the (a) orange, (b) green, and (c) blue boxes in lower panel of Fig. 2.
This large number of statistically independent images (and the related large improvement in speckle contrast) is perhaps at first consideration surprising. Our mode mixer rotates at ~100 Hz and considering the two facets of its reflective surface produces a modulation frequency of ~200 Hz. Since our pixel dwell time is of ~10 msec, this is only about two modulation periods per pixel. To achieve the improvements in speckle contrast that we observed, the mode mixer must be illuminating many modes per revolution.
The same three regions were also fit to the modified Rician density function, shown in Fig. 7. In the limit of small contrast, or high N and r, the gamma density function of Eq. 1 and the modified Rician density function of Eq. 2 are nearly indistinguishable; both distributions become Gaussian-like as the speckle contrast approaches 0. The orange box in the middle left returned r = 98.8, the green box in the lower middle r = 315.6, and the blue box in the upper right r = 84.2. The averaged speckle contrast value of the three sections of the picture was C = 0.124.
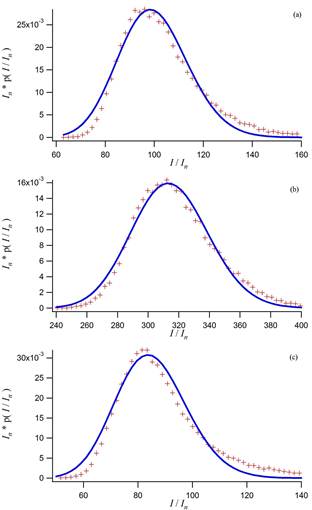
Figure 7. Fits to the Rician function of Eq. 24 for the mode mixed image within the (a) orange, (b) green, and (c) blue boxes in the lower panel of Fig. 2.
Regardless of the method of statistical analysis used, the results are very similar, as predicted by the theory itself.
1. As would be expected, regions from the complex image of the atrium show less fully developed speckle than areas selected from the cloth near the knife. Because the cloth was not backed by any reflective material, the fraction of the reflection which is diffuse should be very high. In contrast, much of the atrium is drywall, whose refection contains a significant specular component.
2. For regions selected from the unaveraged images of Fig. 2, the Rician fits (which allow for a combination of specular and diffuse reflection) showed a somewhat better fit than the Gamma fits, with small variation according to region.
3. Both the Rician and Gamma fits confirmed large reduction in speckle contrast constants of between 6.5 and 12.5.
We have demonstrated in a large volume a general active imaging method based on modulated mixings of many illumination modes that significantly reduces coherent effects (such as speckle). It also eliminates the need for the strategic target orientation typical of many demonstrations of active imaging. The resultant images have many of the favorable characteristics of passive images, but with orders of magnitude greater brightness temperatures.
More specifically we have shown:
(1) To achieve a significant reduction in the speckle contrast, the target must be illuminated from many modes, with the speckle reduction factor being N1/2, where N is the number of independent modes.
(2) Large values of N (>100) can be obtained with simple mode mixing strategies.
(3) This approach is made practical by the high brightness temperatures (1014 – 1018 K) that can be attained with narrow band electronic illuminators.
(4) Because of this high brightness, this approach can be implemented by scattering from surfaces of large volumes (e. g. ~ 100 m in arenas or atriums) or for larger (~ 1 km) and outdoor applications by more directed illumination strategies.
(5) The scattering illumination is much more efficient for use with focal plane arrays because the entire target collects a much larger fraction (x 104) of the photons from a scattering surface than does a single pixel.
(7) For room temperature operation, the required detector sensitivity is best obtained in narrow bandwidth, heterodyne receivers. The higher powers associated with vacuum electronic sources are capable of supplying the required local oscillator power to large arrays.
(8) For the longer ranges and to broaden the range of scenarios by reducing the requirements on appropriate scattering surfaces, the powers associated with vacuum electronics are very useful.