Now we will analyze the motion of the basketball using the data collected in Part 1!
You will create and analyze a height vs. time plot and use that toestimate the value of gravitational acceleration, g.
Here are some questions to consider about the basketball data
Find the csv file you downloaded in Part 1 and open it in Excel or Google Sheets to view the data. You will see three columns in the spreadsheet: time (in seconds), x-position (in meters), and y-position (in meters). In this activity we focus on the time and y-position data because our goal is to estimate the gravitational acceleration, g (which only occurs in the y-direction).
Take a look at the time column. How frequently did the object tracker program report the position of the basketball (how many times per second)?
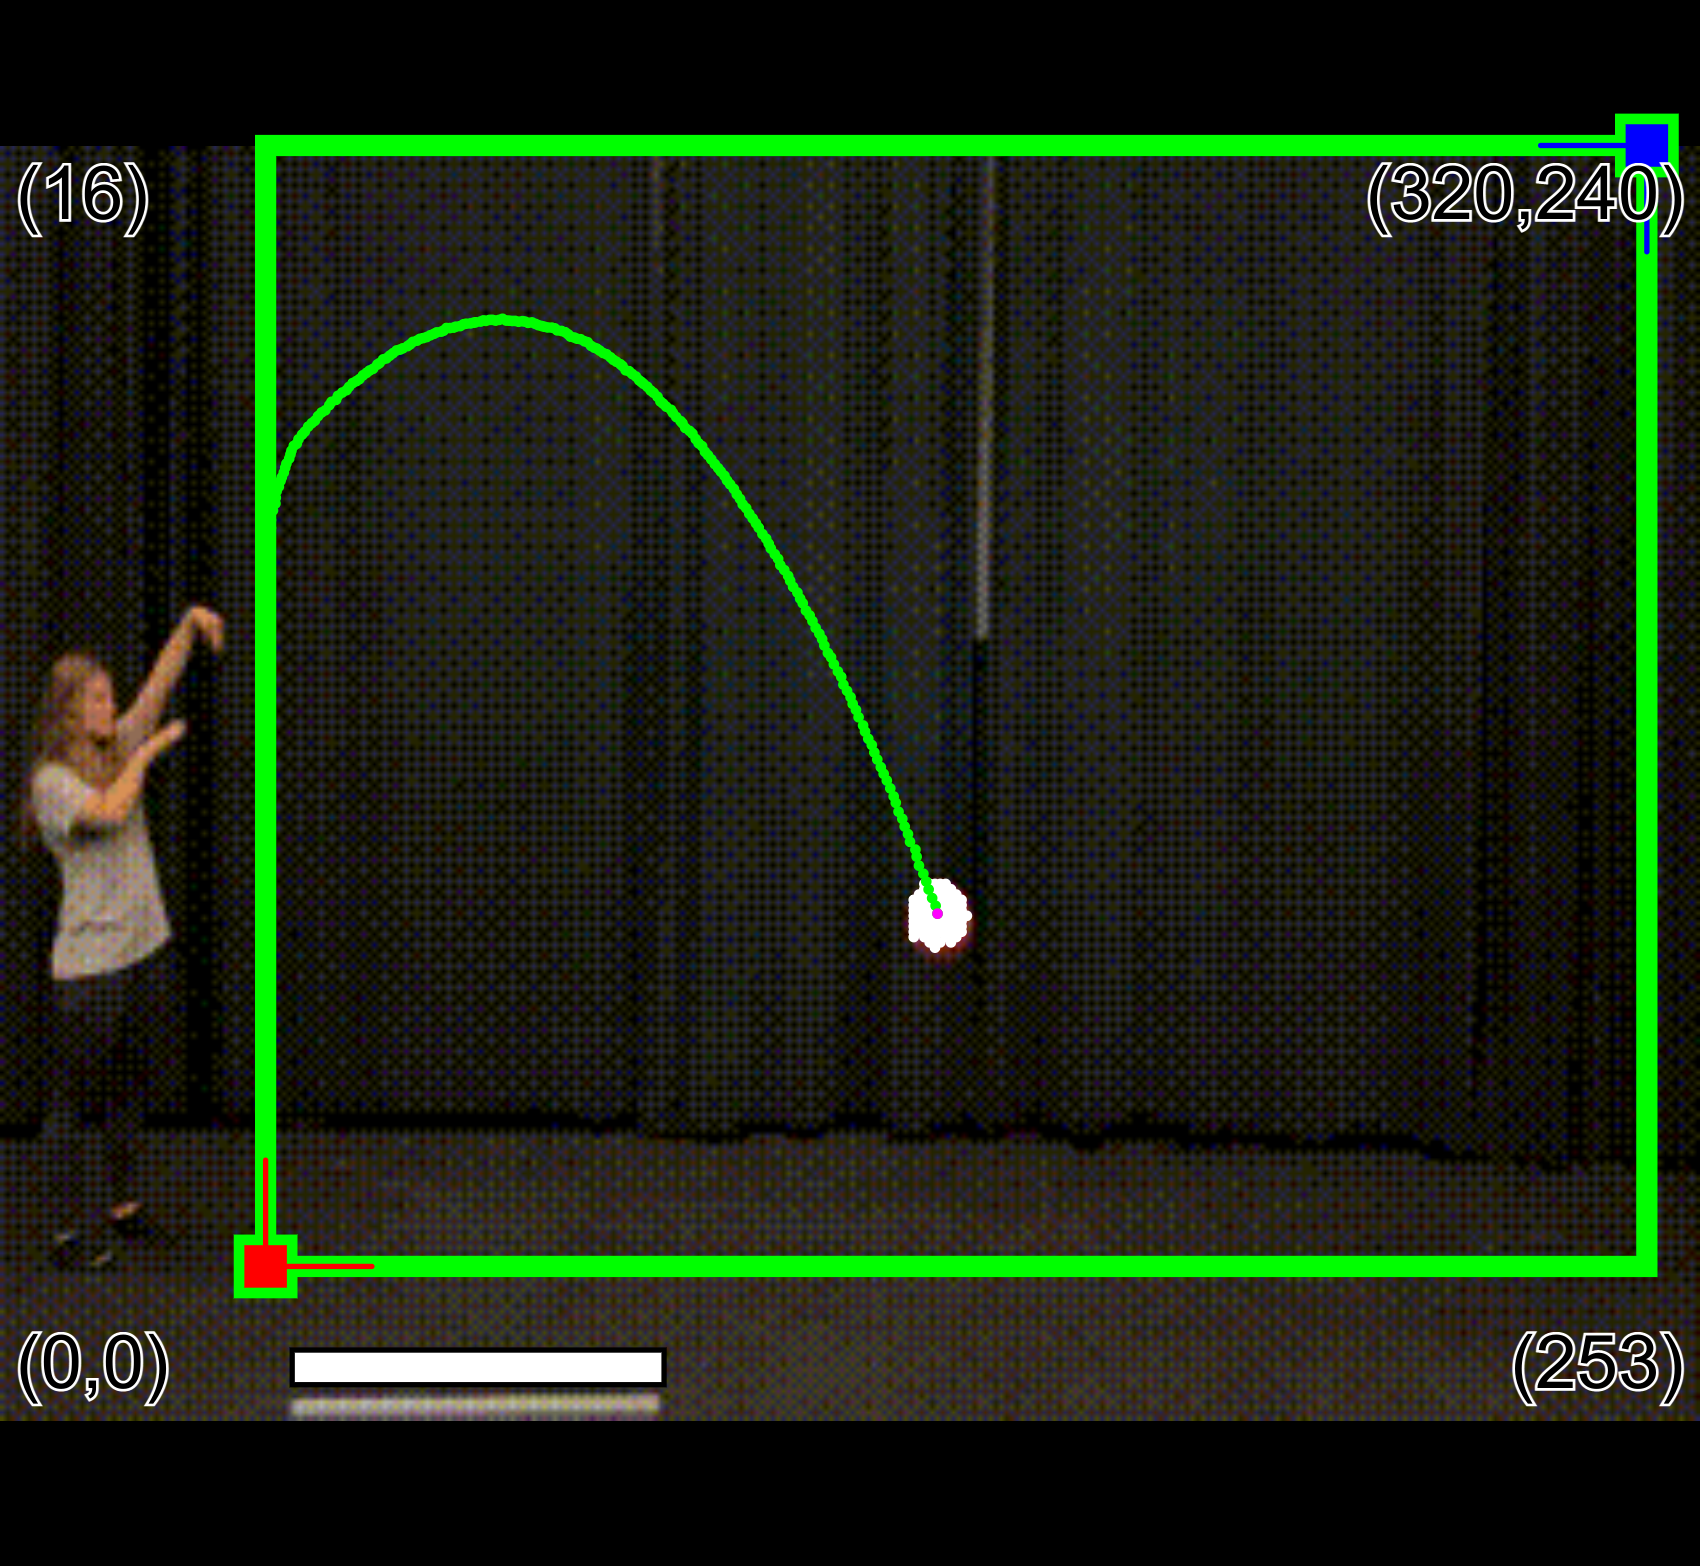
Note: You may see the phrase "Object out of range?" in the first several rows of the x and y columns. This means there is no position data at those times. One possible reason for this is that the object is outside of the green rectangle at that time. Note and explain any instances of "Object out of range?" in your data. Are there any instances of "Object out of range?" when the object is actually in range?
Before making the plot, think about what you expect it to look like. As time passes, how does the height change? Will it look linear or curved?
If you aren't sure how to make a scatter plot, refer to Step 1 in these instructions for Excel or Google Sheets. Does the plot look how you expected? What type of function does it resemble?
The plot is a visual representation of the relationship between y and t. Now we will to find a mathematical equation to describe that relationship by fitting a trendline to the plot.
First, determine what type of trendline will best fit the data (linear, exponential, polynomial, logarithmic, or power). Based on your knowledge of physics, what type of equation do you expect the data to follow? Hint: The basketball is moving with approximately constant y-acceleration (due to gravity), so the kinematic equations apply here -- What type of function is y(t)?
Add the appropriate trendline and display its equation on the plot. If you aren't sure how to do this, refer to Step 2 in these instructions for Excel or Google Sheets. Record the trendline equation.
The basketball's motion should roughly follow the kinematic equation $ y(t) = y_i + v_{yi} t + \frac{1}{2} a_y t^2 $ (where ay is y-acceleration). Infer the y acceleration by comparing this kinematic equation to your trendline equation from Step 2. Hint: You only need to worry about the 1st term of the equation ($\frac{1}{2} a_y t^2$) since we are only finding ay.
If you do not get -9.8 m/s2 for the y acceleration, is your data still consistent with -9.8 m/s2? What could we do to make the experiment more precise and/or accurate?
In this activity "gravitational acceleration" (g) and "y-acceleration" (ay) have been used somewhat interchangeably to make things simple. Are there any other forces besides gravity contributing to acceleration in the y direction? If so, why did we not consider that in the estimation? Explain.
Turn in the answers to your questions wherever your teacher said you should turn it in!