
Recent Data
Figure 1.
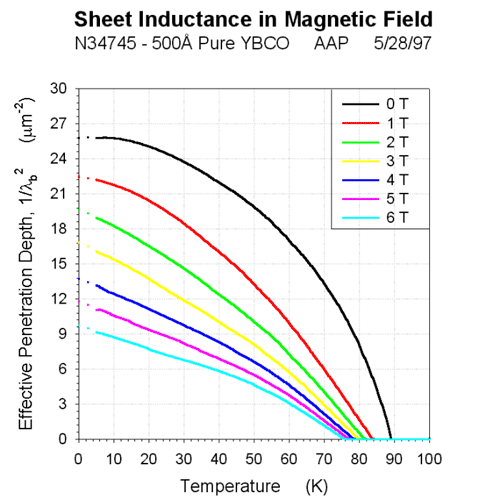
Effective penetration depth vs. temperature. The top curve is B = 0 Tesla. The curves then descend from 1 to 6 Tesla in order. leff2 is proportional to the imaginary resistivity of the film. For B = 0, the effective penetration depth, leff is just the magnetic penetration depth of the superconducting film and 1/l2 is proportional to the superfluid density. In higher fields, leff is the penetration required by a film in zero field to produce the same resistivity as observed in the sample. Data were taken between 5 K and 100 K. AAP 9/30/98
Figure 2.
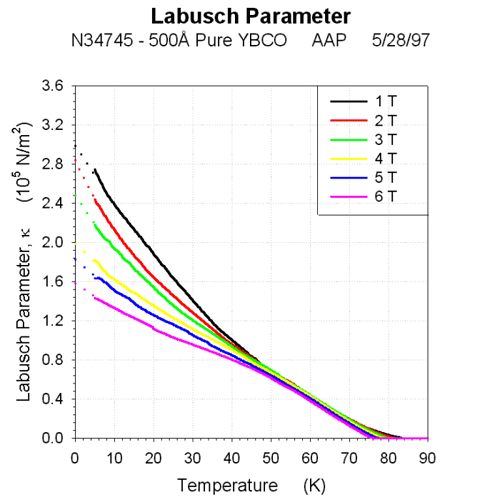
Experimental Labusch parameter vs. temperature. kexp is the measured linear restoring force constant per unit length of the pinned vortices. 1/kexp is proportional to the inductance per vortex. The top curve is B = 1 Tesla with the curves then descending from 2 to 6 Tesla. Data were taken between 5 K and 100 K. AAP 9/30/98
Figure 3.
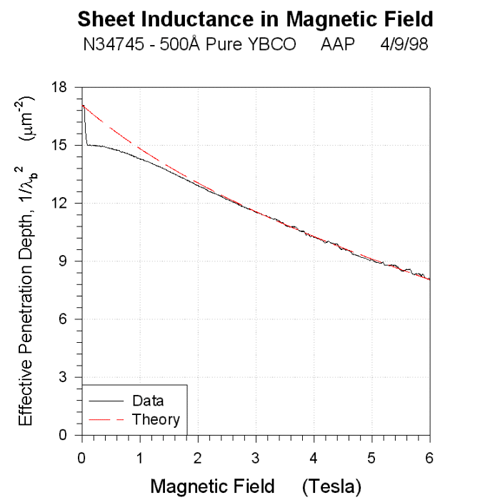
Effective penetration depth vs. magnetic field. leff is proportional to the imaginary resistivity of the film. The dotted line is the effective penetration depth predicted by our model. AAP 9/30/98
Figure 4.
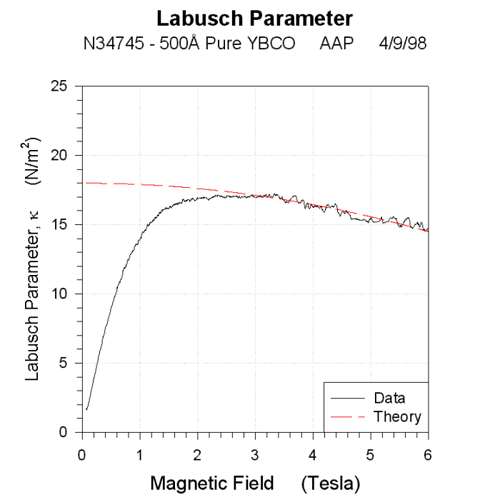
Labusch parameter vs. magnetic field. kexp is the linear restoring force constant for the pinned vortices. 1/k exp is proportional to the inductance per vortex. The dotted curve is the Labusch parameter predicted by our model. AAP 9/30/98
Figure 5.
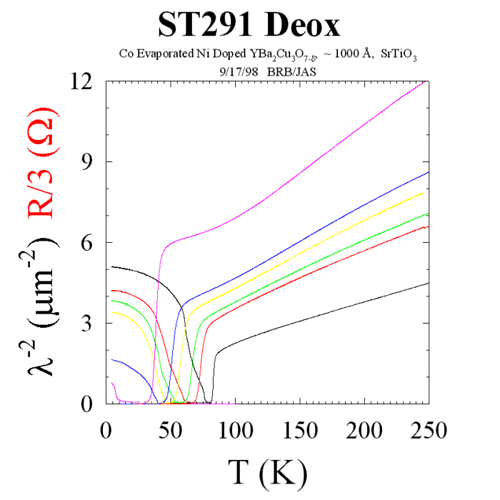
Deoxygenation of Ni Doped YBCO. Resistivity and superfluid density curves are shown for each successive deoxygenation step. The same color is used for both the resistivity and superfluid density after each step. Resistivity increases and superfluid density decreases. Black curves are fully oxygenated. BRB/JAS 9/30/98
Figure 6.
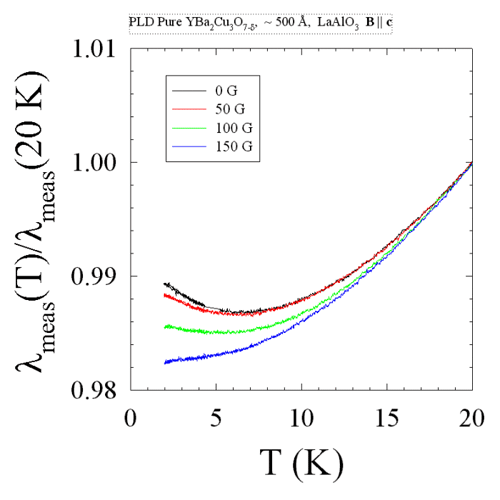
Andreev Scattering affected by Vortices. Shown are the low temperature temperature dependence of the magnetic penetration depth in a pure YBCO thin film. Various fields indicated are oriented perpendicular to the film, parallel to the c axis. In zero field, the film shows re-entrant behavior in the penetration depth as would result from Andreev Reflection at superconductor insulator interfaces. Interaction with field induced vortices either masks or minimizes Andreev Reflection. Temperature and field dependencies are unknown. BRB 9/30/98
Figure 7.
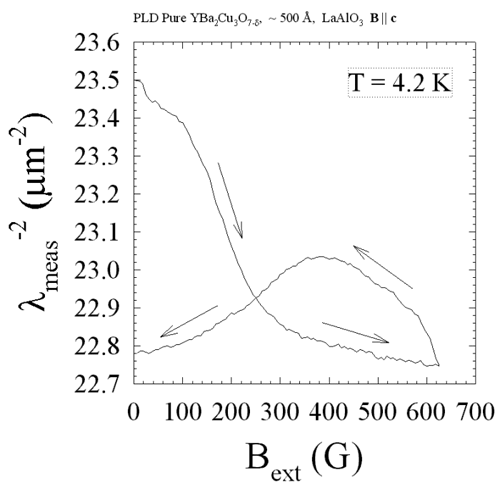
Hysteresis in Measured Penetration Depth. The inverse squared penetration depth is plotted versus a small magnetic field oriented perpendicular to the film taken at constant temperature (4.2 K). Increasing and decreasing field are indicated by arrows. Film is cooled in zero field. Hysteretic behavior is dependent on film growth technique. BRB 9/30/98
Figure 8.
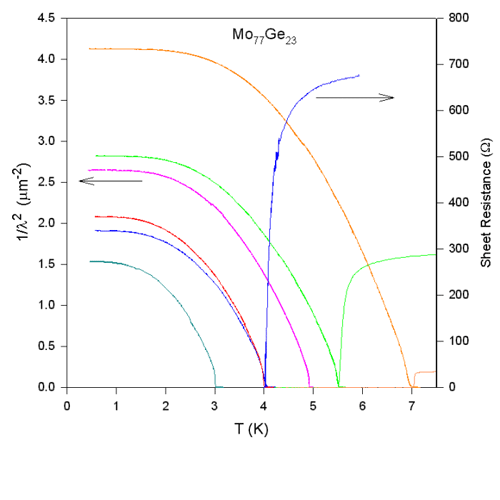
We have been studying the effects of thermal fluctuations on the complex conductivity of thin film superconductors using a two-coil mutual inductance technique. a-Mo 77Ge23, a BCS superconductor, is an excellent material for studying fluctuation effects (small deviations from mean-field behavior) for the following reasons; (a) a low superfluid density, (b) very homogeneous thin films with large perpendicular penetration depth, and (c) the well known dirty limit BCS temperature dependence for the mean field temperature dependence of the superfluid density. The films shown have thickeness of 21.5, 30, 30, 46, 61 and 500 Angstroms with the transition temperature and ns(T) increasing as the film thickeness increases. All films have D (0)/k BTC=1.89(3). All Mo 77Ge23 films were sputterd by Prof. John Graybeal at U. of Florida. SJT 9/30/98
Figure 9.
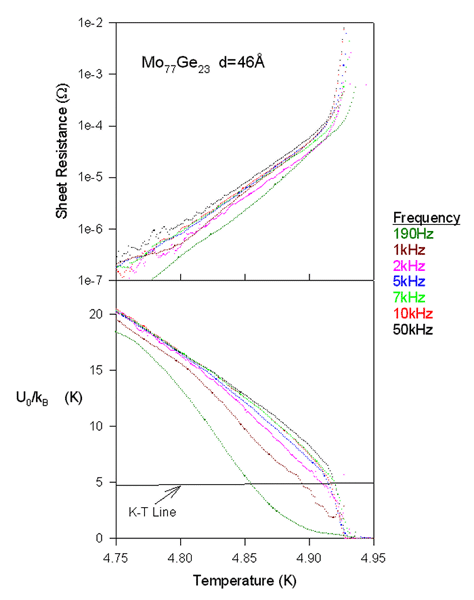
Frequency dependence of the complex sheet impedance for the 46 Angstrom thick Mo 77Ge23 film near the transition temperature. The frequency dependence is due to vortex -antivortex pairs and suppresses the mean-field transition temperature and the vortex-antivortex unbinding temperature. U0 /kB is the inverse sheet inductance normalized to have units of temperature and which according to Kosterlitz-Thouless theory should be equal to the transition temperature at T/C. At frequencies of 50kHz and above the sheet inductance due to vortices becomes much less than the superfluid background sheet inductance. Thus we can compare the measured sheet inductance at high frequency with the dirty limit BCS theory for the superfluid density. We have found that the background superfluid density is suppressed below the mean-field value as the transition is approached from below. This suppression is the result of longitudinal current fluctuations. SJT 9/30/98
Figure 10.
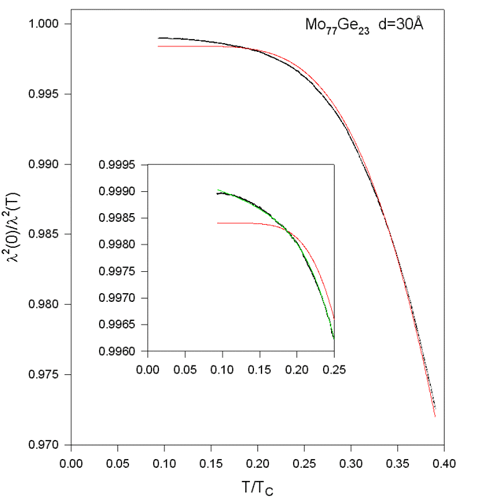
Normalized superfluid density vs. T/TC (black line) for a 30 Angstrom thick Mo 77Ge23 film. The red line is the best dirty limit BCS fit up to 40% of TC. Note that the deviation between BCS theory and the data is less than 0.5%. The green line is a fit which includes a term quadratic in T in addition to the dirty limit BCS formula. The origin of this low temperature deviation from BCS is not yet clear. However the size of the deviation increased systematically as the film thickness decreased for all of the films measured. SJT 9/30/98