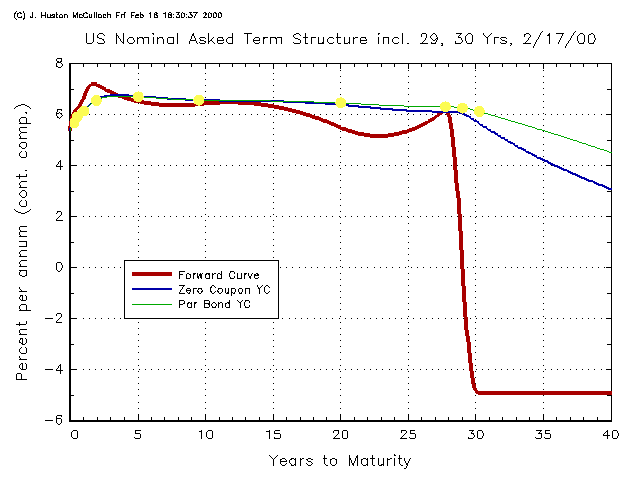
Figure 1
Rev. Feb. 18, 2000
This page demonstrates that investors are actually paying the Treasury over 3% on an annualized basis to keep their money for an extra year and a quarter by buying the new 30.25-year bond maturing 5/3030 instead of the 29-year bond maturing 2/2029, and are getting nothing by buying the 29 instead of the approximately 28-year bond maturing 11/2027.
Figure 1 below shows the (nominal) term structure of interest rates for 2/17/2000, based on selected US Treasury Securities out to 30 years. The maturities chosen are approximately 3 months, 6 months, 1 year, 2 years, 5 years, 10 years, 20 years, 28 years, 29 years, and 30 years. Except for the "bellwether 30", the securities used are chosen for their high asked yields, regardless of whether or not they were OTR, although unusually illiquid (high bid/asked spread) securities were avoided. Asked quotations on the selected securities, as reported in the Wall Street Journal for 2/18/00 were fit exactly with a "QN Spline" log-discount function, as described in McCulloch and Kochin (1998), linked below.
The forward curve indicates the marginal return to maturity investors obtain by extending the maturity of a single payment at the maturity in question. Its average value between 29.00 and 30.25 years to maturity is -3.09% per annum, indicating that investors are actually paying the Treasury at this rate to keep their principal for the extra year and a quarter between 2/2029 and 5/3030!
The average forward rate between 27.75 and 29.00 years is -0.40% per annum, indicating that investors are losing even a little more return to maturity by buying the 2/2029 instead of the 11/2027. Below 28 years the forward rates are not as high as under 15 years, but at least they are positive.
The forward curve has two additional, alternative simple interpretations in terms of expected returns and/or future interest rates: On the one hand, if securities of all maturities are expected to have equal returns over all holding periods, the forward curve traces out the market's expectation of the future short-term interest rate. On the other hand, if the yield curve is expected to retain its current shape with respect to maturity, the forward curve gives the expected rate of return over the immediate future on payments of the indicated maturity.
The upslope at the short end of Figure 1 undoubtedly reflects fact that investors are content to receive lower returns on these maturities in exchange for their greater liquidity for purposes of cash management over the near future. On the other hand, the fact that the forward curve is noticeably lower between 20 and 28 years than it is from 2 to 15 years may reflect some kind of legitimate market conditions related to the demographics of the Baby Boom, and expected future interest rate swings.
Beyond 28 years, however, the forward rates implicit in the bond prices drop like a rock. There is no reason the market would expect such a sudden drop in future interest rates at precisely these maturities, so an "expectations hypothesis" interpretation is out. The alternative is a "maturity premium" interpretation, that investors expect the yield spread spread to persist, as a function of maturity, and so may expect to receive a smaller return on payments due in 30 years over the immediate future. But the implied smaller return is precisely the negative forward rates!
The slight decline in the yields to maturity on the last three bonds included (6.41%, 6.36%, and 6.22% on a bond equivalent basis, respectively) has a greatly magnified effect on forward rates at these long maturities. The simplest explanation of the negative forward rates is that investors may simply not be fully aware how great this effect turns out to be.
To be sure, the total return on a 30-year bond is an average of the returns on all its payments. Only the principal (which is only about 18% of the value of the bond) has a negative expected return over the coming year and a quarter, while the coupons (which give the bond the remaining 82% of its value) have (by assumption) a normal return. But even 18% of an almost 900 bp spread below the Fed Funds Rate readily available on riskless and totally liquid investments is still some 160 bp.
The 30-year bonds admittedly have lower bid/asked spreads than do the 28- and 29-year bonds: 1/32 per $100 of face value versus 2/32, according to the WSJ quotes. By all rights, this should make them the better long-term investment, because it allows their asked yields (which reflect the yield to maturity obtained by buying them) to be higher. At the same time, they can also be the best long-term bond to sell out of one's portfolio if needed, because it allows their bid yields (which reflect the yield to maturity foregone by selling them) to be lower. But if their asked yields are lower despite their smaller spreads, investors should not be buying them in the first place.
If investors truly just want a liquid "safe haven" in which to park their money for a few days, while the stock market crashes or foreign currencies collapse, for example, they can get it plus a safe 5.68% on their money by buying 3-month T-bills instead of 30-year bonds, without the substantial risk of capital losses.
Although the charts shown above are for only one arbitrarily selected day, the negative forward rate phenomenon they depict in fact has prevailed through most of the period since August 1998. If anything, the forward rates have typically been even more negative during this period.
According to Duffie (1996, below), investors are often compensated for the lower current yield on OTR bonds through being able to borrow against them at a "Special Repo Rate." However, the average "specialness" he reports for the 30-year bond is only 59 basis points, barely enough to compensate for the negative expected return on the principal, even abstracting from non-performance risk.
A Repurchase Agreement on a short-term T-bill has negligible non-performance risk, because of the very small price movements in either direction that might occur. However, daily price movements of $1 per $100 are not uncommon on 30-year bonds. The Repo market takes these in stride, but if 1% moves are common, larger moves can occur occasionally as well. On Feb. 3, 2000, for example, the 30-year bond price rose by 3% at one point during the day. This was sufficient, according to the New York Times (2/4/00, p. C1), to generate "rumors of significant losses sustained by banks, brokerage firms and hedge funds said to be on the wrong side of the Treasury Market's move," and to "roil the market, reminding participants of the crisis created by the near collapse of the Long-Term Capital Management hedge fund" in September of 1998.
Despite the rumors, no one actually went under on that day. However, the figures in McCulloch (1985) suggest that the option value of nonperformance on a long-bond Repurchase contract in the face of even bigger, albeit rare, price movements may in fact be an important consideration, and that the market may be underpricing this option through a false assumption of Gaussian disturbances. A strategy of buying the "bellwether 30" in order to exploit the "Special Repo Rate" rather than to hold it as an investment is therefore not clearly advantageous.
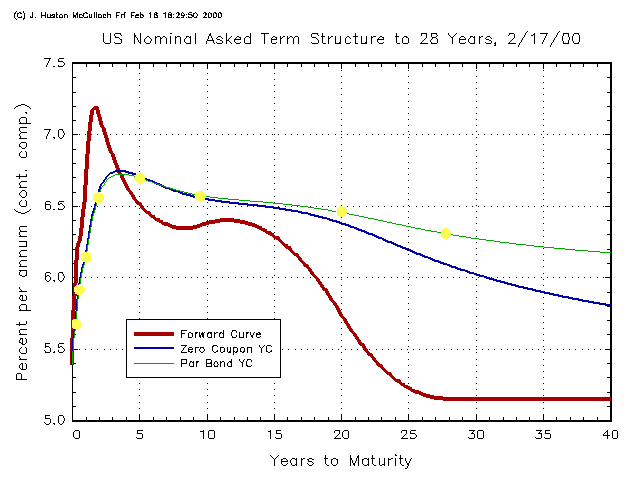
Figure 2 below shows the nominal US Term Structure using the same set of bonds out to 28 years, but without the overpriced 29s or 30s.
The Treasury has recently announced plans to buy back off-the-run long-term bonds with "reverse auctions," presumably financing these repayments with increased borrowing at other maturities. In light of the negative forward rates implicit in the forward curve, such reverse auctions actually make sense. If investors are crazy enough to accept negative returns on their money, the Treasury has a fiscal obligation to the taxpayers to to milk them for all they are worth. However, since most of the action is between 28 and 30 years, it should be buying back 28-year bonds, rather than 20-year bonds, as has been discussed in the press.
McCulloch, J. Huston. "Interest-Risk Sensitive Deposit Insurance Premia: Stable ACH Estimates," Journal of Banking and Finance 9 (1985): 137-56.
McCulloch, J. Huston and Levis A. Kochin. "The Inflation Premium Implicit in the U.S. Real and Nominal Term Structures of Interest Rates," Ohio State University Working Paper No. 98-12, August 1998. Click here for PDF version.
The US Real Term Structure of Interest Rates
with Implicit Inflation Premium
All yields on the accompanying charts are computed on a continuous compounding basis. A continously compounded rate R may be converted to a bond-equivalent (or coupon-equivalent, or semiannually compounded) rate B by means of the formula:
This page written and maintained by J. Huston McCulloch, at mcculloch.2@osu.edu
Views and numerical estimates presented on this page are solely those of the author and are not endorsed by the Ohio State University, nor by its Departments of Economics or Finance. Graphs and data may be reproduced in electronic or printed form, provided the author and this website are cited as its source and the copyright notice incorporated. No warranty for use of this data is implied.
Page last revised 2/18/2000.