The US Real Term Structure
of Interest Rates
with Implicit Inflation Premium
presented by
Department of Economics, Ohio State University
Updated to 10/30/09
Contents
New Charts

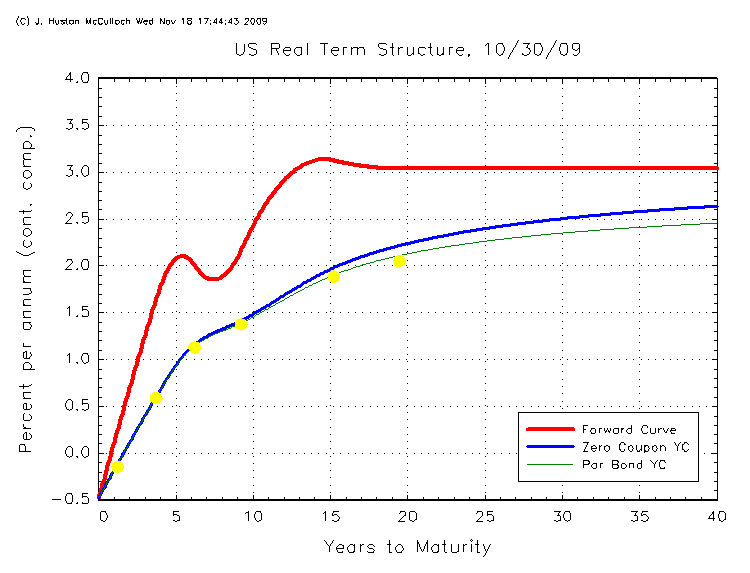
8- to 10-year TIPS are still out of line, even replacing 7/18 with 1/18.

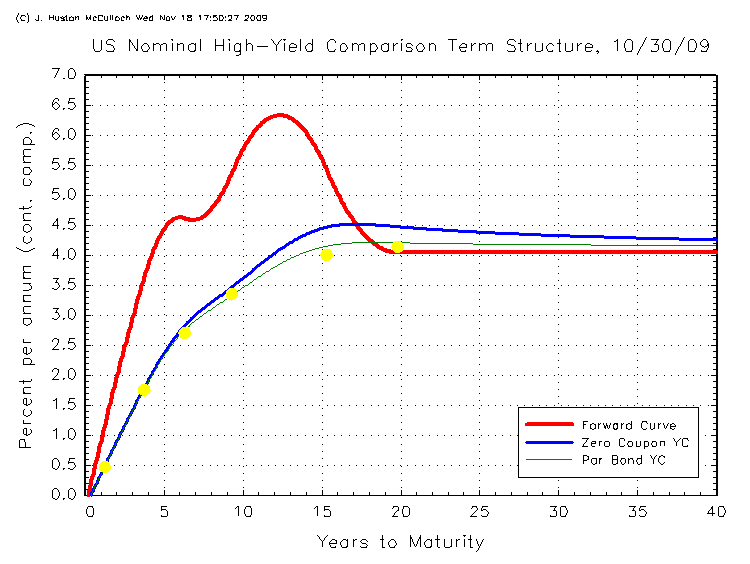
High-yield 7- and 10-year nominals are also high-coupon, and hence lie below rising par yield curve.


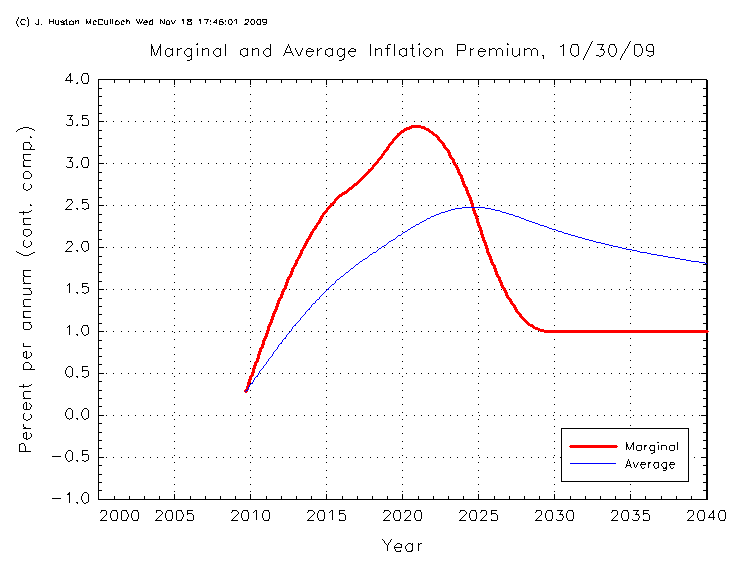
Despite the prospect of substantial near-term inflation,
the average inflation
premium on nominals is actually negative out to 2016.
View archive below
Return to top of this page
Inflation 
CPI-U inflation to Oct. 2009 (continuously compounded, per annum)
- last 24 mo: 1.70% (last 12 mo. distorted by 2008 fuel price spike)
- last 5 year: 2.49%
- last 10 yr.: 2.51%
Outstanding Indexed Issues
As of Sept. 30, 2009, there are 30
US Treasury Inflation-Protection Securities (TIPS)
outstanding, listed below, with an inflation
adjusted value of $551.7 billion and growing fast.
TIPS are now 7.9% of all outstanding
marketable US Treasury issues, coupon and noncoupon
alike (total marketable issues, $7.010 trillion and
growing even faster, so that the TIPS share has fallen
somewhat in the last year).
In the past, maturing TIPS have had erratic quoted
yields, as the 2.5 month indexation lag becomes an
important factor in their pricing. See
subpage on the behavior
of the 7/02i. Accordingly, TIPS with less than
1 year to maturity are not used for these charts.
Click here for
details of the TIPS program, here for
current and historical Reference CPI Numbers and Daily Index Ratios,
and here for the
official BLS CPI-U figures.
Treasury Inflation-Protection Securities (TIPS)
Jan. 31, 2008
| Mat | Coup. | $B |
| 1/15/2010 | 4 1/4 | 14.5
|
| 4/15/2010 | 0 7/8 | 31.8
|
| 1/15/2011 | 3 1/2 | 13.6
|
| 4/15/2011 | 2 3/8 | 21.9
|
| 1/15/2012 | 3 3/8 | 7.3
|
| 4/15/2012 | 2 --- | 18.3
|
| 7/15/2012 | 3 --- | 27.6
|
| 4/15/2013 | 0 5/8 | 15.3
|
| 7/15/2013 | 1 7/8 | 23.5
|
| 1/15/2014 | 2 --- | 24.5
|
| 4/15/2014 | 1 1/4 | 8.4
|
| 7/15/2014 | 2 --- | 21.7
|
| 1/15/2015 | 1 5/8 | 21.4
|
| 7/15/2015 | 1 7/8 | 18.8
|
| 1/15/2016 | 2 --- | 18.4
|
| 7/15/2016 | 2 1/2 | 21.3
|
| 1/15/2017 | 2 3/8 | 18.4
|
| 7/15/2017 | 2 5/8 | 14.5
|
| 1/15/2018 | 1 5/8 | 16.9
|
| 7/14/2018 | 1 3/8 | 15.0
|
| 1/15/2019 | 2 1/8 | 14.8
|
| 7/15/2019 | 1 7/8 | 8.2
|
| 1/15/2025 | 2 3/8 | 32.0
|
| 1/15/2026 | 2 --- | 21.7
|
| 1/15/2027 | 2 3/8 | 17.6
|
| 1/15/2028 | 1 3/4 | 16.1
|
| 4/15/2028 | 3 5/8 | 22.3
|
| 1/15/2029 | 2 1/2 | 14.2
|
| 4/15/2029 | 3 7/8 | 25.5
|
| 4/15/2032 | 3 3/8 | 6.1
|
| Total |
| 551.7
|
Source:
Entire Monthly Statement of the Public Debt.
When last checked (some time ago), real-time bid/asked quotations on Treasury and non-Treasury inflation-
linked securities could be found on the Bloomberg Screen
service, by entering TII <GOVT> <GO>. The pricing source
is listed in the last column. The default source
(BGN = Bloomberg Generic, a consensus price)
may be changed by using the PCS function.
The three on-the-run TIPS are also quoted at C <GOVT> <GO>,
alongside the on-the-run nominals.
Asked quotations on on-the-run Treasury securities, both
real and nominal, were available
on the
Bloomberg Website, with only a few minutes' delay.
Return to top of this page
WSJ drops Treasuries
 In its new, down-sized format for 2007, the Wall St. Journal has
discontinued daily print coverage of quotes from the $4.4 trillion market for US Treasury bonds, notes
and bills. The New York Times has likewise discontinued
print coverage of this market.
WSJ subscribers may still access this information online. An historical
archive has been kept, but for TIPS only since mid-June 2007, and for nominals only since mid-June 2008. Consequently, the data on this site for 1/07 is for the last Friday of
the month, 1/26/07, from Barron's, rather than for the last day of the month as customary.
Data for 2/07 and after are for the last business day, obtained from
the WSJ Online.
Archive
For each date, the table gives a link to
- "Real" -- Chart of Real Term Structure
- "Nom" -- Chart of Nominal Comparison Term Structure
- "CPI" -- Chart of Forward CPI
- "Inf" -- Chart of Marginal and Average Inflation Premium
- "Data" -- Data file
If you use this data in published research, please cite this website in your
references.
Note -- The real curve for 8/31/2000 used an erroneous quotation
for the 4/29. This error, which was called to my attention by
Marcello Pericoli of the Banca d'Italia, was corrected 12/3/09.
* Notes
- 11/08, TIPS and Nominal markets both unsettled. 10-year yields out of line,
even temporarily replacing low-yield 1.375 7/18 real
with 1.625 1/18 real. Nominals unchanged.
- Effective 10/08, high-yield 2.125 1/31/2010n replaces 3.625 1/15/2010,
10.625 8/15/2015 replaces 4.125 5/15 2015,
9.125 5/15/2018 replaces 3.875 5/15/2018. Despite roller-coaster in real
forward curve, selected TIPS are representative of their sectors.
High-yield nominal 7- and 10-year bonds have high coupons, and hence
yield below the rising par yield curve.
- Effective 7/08, new 1.375 of 7/18 replaces 1.625
of 1/18, 3.875nom of 5/18 replaces 3.5nom of 2/18.
For 7/31/08, WSJ gave wrong coupons for 2.375real of 1/25,
3.875real of 4/29, and 3.625real of 4/32. These were
corrected by hand.
- 11/02/07 represents end 10/07 because WSJ does not archive
nominal quote data, did not collect in time.
- Effective 8/07, new 4.75% of 8/17nom replaces
4.5% of 5/17nom for comparison to 7/17i.
- Effective 7/07, the new 7/17i replaces 1/17i.
For comparison, 4.5% of 5/17nom replaces 4.625% of
2/17nom.
- Effective 4/07, the newly enlarged 1/17i replaces 7/16i.
For comparison, 2/17nom replaces 8/16 nom.
- 2/07 and subsequent from WSJ online.
- 1/26/07 Last Friday of Month quotes from Barron's,
since daily quotes no longer published in WSJ.
- Effective 1/07, included indexed securities are 1/09 (to avoid the
maturing 1/08), 4/11, 1/14, 7/16, 1/25, and 4/29. Comparison nominals
mature 1/09 (4.875%), 4/11, 2/14, 8/16, 2/25, and 8/29.
- Effective 10/06, 0.875% 4/10i replaces 3.5% 1/11i,
because the substantially larger outstanding volume
of the former presumably makes it more liquid and
representative of the market. Correspondingly,
4% 4/10nom replaces 4.25% 1/11nom, as prior to
8/06.
- 9/29/06 date corrected 10/3/06.
- Effective 8/06, new 2.5% 7/16i replaces 2% 1/16i and
3.5% 1/11i replaces 0.875% 4/10i, the latter for better
spacing. Correspondingly,
4.875% 8/16nom replaces 9.25% 2/16nom and 4.25% 1/11nom replaces
4% 4/10nom.
- Effective 6/06, 4.5% 2/16nom replaces 9.25% 2/16nom.
- Effective 1/06, new indexed issues are 1/08i, 4/10i, 6/13i,
1/16i. Old 1/25i and 4/29i are retained. New nominal comparison
issues are 1/08nom, 4/10nom, 4.25% 8/13nom, and 9.25% 2/16 nom. Old
2/25nom and 8/29nom are retained. 1/07i has been dropped to avoid
erratic effects as its maturity approaches. On the 7/02i,
see subpage.
- Effective 7/05, 4.25 1/10i, 3.000 7/12i, and 1.875 7/15i
replace 3.500 1/11i and 1.625 1/15i. Also, 3.625 1/10nom,
3.375 8/12nom, and 4.125 4/15nom replace 5.000 2/11nom
and 4.250 11/14nom.
- Effective 1/05, 1/15i replaces 2/14i, 11/14nom replaces 5/14nom,
and 1/07nom replaces 2/07nom.
- Effective 7/04, 2.375 1/25i and comparison 7.625 2/25nom added.
Also, 2.00 7/14i, 3.50 1/11i, 4.75 5/14nom, and 5.00 2/11nom
replace 2.00 1/14i, 4.25 1/10i, 4.25 11/13 nom, and 6.50 2/10nom.
The new hump in the comparison nominal and inflation curves are due to
the addition of the 2/25nom for comparison to the new 1/25i, rather than
to a change in the market.
- Effective 3/04, 2.25 2/07nom replaces 6.25 2/27nom.
- 2/27/04 corrected 3/12/04 using New York Times quote for 1/07i.
See subpage.
- Effective 1/04, 1/14i replaces 7/13i, and
4.25 11/13nom replaces the 3.625 5/13nom for comparison.
- Effective 7/03, 7/13i replaces 7/12i, 5/13nom replaces
8/12nom, and 1/10i and 2/10nom have been included.
- Effective 8/02, 8/12nom replaces 2/12nom.
- Effective 7/02, real term structure is based on 1/07i, 7/12i,
and 4/29i. Comparison nominal term structure is based on 2/07nom,
2/12nom, and 8/29nom.
- For 6/02, NYT quote for maturing 7/02i used in place of
improbable WSJ quote. See subpage.
- Effective 2/02, 4/32i replaced with higher yielding old 4/29i.
Data originally posted 3/4/02 for 2/02 revised with this change 3/6/02.
See subpage.
- Effective 1/02, 1/11i replaced with new 1/12i, and 2/11nom replaced
with 8/11 nom.
- Effective 10/01, 4/29i replaced with new 4/32i, 2/29nom replaced with
8/29nom, and 10/10nom replaced with 2/11nom. 10/31/01 term structures
include the unusual real and nominal price jumps following the Treasury's
10/31 announcement that it is discontinuing further auctions of 30-year
nominal or indexed bonds.
- Effective 1/00, indexed 1/10 replaced with new 1/11, and nominal 11/27
replaced with 11/28.
- 3/31/00 - 10/31/00, forward CPI graphs and data values are
based on the uncorrected CPI-U for 1/00-8/00. See
subpage.
- 8/31/00, real curve and derived inflation and cpi curves corrected
12/3/09 for an error in the price of the 4/29. This raises the
long end a little.
- Effective 3/31/00, four indexed and nominal bonds
are used to fit the real and nominal term structures,
including the indexed 1/07 and the comparable-maturity
nominal 2/07.
- Effective 1/31/00, Nominal Comparison, Forward CPI, and Inflation Premia data
were revised retroactively, to eliminate
use of the on-the-run 30-year bond. Real
Term Structures are unaffected by this revision,
except for 5/99. The
new data files are named term0100.txt, etc, and have an
additional header line, whereas the old data files were
named real0899.txt, etc.
- 5/28/99 real term structure slightly revised 3/6/00.
- On 7/97-3/98, only the 5- and 10-year indexed notes had
been issued, so that these real term structures beyond 10
years are based entirely on extrapolation. The nominal
comparison term structures for these dates are likewise
based on only
these two maturities as well. Charts for dates other
than 7/97 are not yet available.
- On 1/97-6/97, only a 10-year indexed note had been issued,
so that the estimated real "term structure" is flat at its
yield (converted to continuous compounding). The nominal
comparison "term structures" for these dates are therefore
likewise based on only one security as well. Charts for
these dates are not yet available, but are trivial since they
are all flat.
Return to top of this page
Explanation of Charts
The above charts of the real term structure
are based on selected price-level indexed indexed notes and bonds,
using late afternoon bid/asked mean prices as reported
in the Wall Street Journal.
The yellow dots indicate the maturity and yields-to-maturity of
the securities used to fit the term structure. The green
line gives the real Par Bond Yield Curve, defined as the coupon rate
that would make an indexed bond of the given maturity just sell at par.
The yellow dots should lie on or very nearly on this line.
The blue line is the real Zero Coupon Yield Curve,
which gives the discount rate for single real payments
at the indicated maturities.
The red line is the corresponding real Instantaneous Forward
Interest Rate curve. All rates on these charts are on a continuous-compounding
basis (see below).
The underlying real log-discount function has been fit
by means of an exact Quadratic-Natural (QN) Spline, as developed in
McCulloch and Kochin (1998), referenced and linked
below.
Data for these curves is linked in the
archive above.
The Nominal High-Yield Comparison Term Structure is fit using
non-callable nominal bonds or notes of similar maturities to the
three (or now four) indexed bonds used for the Real Term Structure. For this purpose,
on-the-run issues are avoided if they appear to have appreciably lower
yields than nearby off-the-run issues. In particular,
the long bond selected is usually about
two years off-the-run in order to avoid the on-the-run premium. For discussion
of this premium, see my parallel webpage
"The 'Bellwether' 30-Year
Treasury Bond is an Exceptionally Bad Buy." The specific issues
used on 4/28/00, for example, were the 6.0s of 6/2002,
6.25s of 2/2007, the 6.0s of 8/2009, and the
6.125s of 11/2027. Using off-the-run nominal issues makes the
inflation premium appear moderately higher, and therefore
nominals a little more attractive, than when on-the-run nominal
issues are employed.
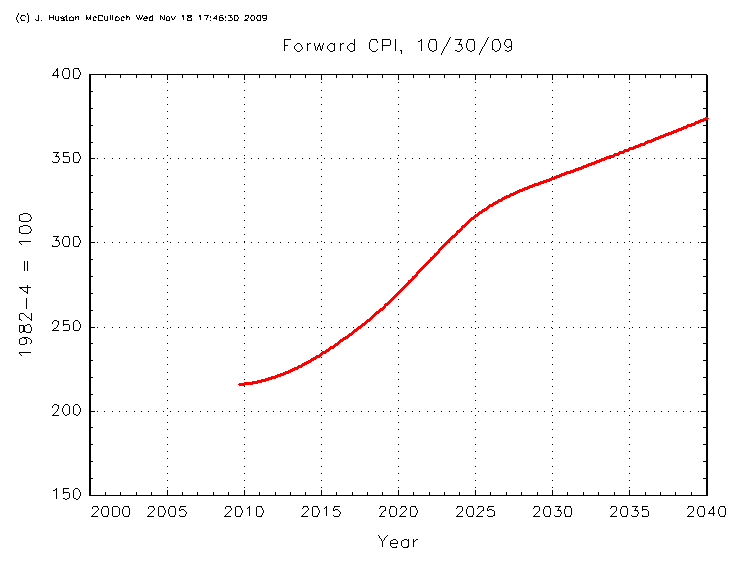
The ratio of the real discount function to the nominal discount function,
times the effective CPI index for the reference date,
defines an implicit Forward CPI curve. This is
plotted above, with a 2.5 month lag to allow for the lag in indexation.
The nominal forward rate curve minus the real forward rate curve
for any given date gives the Marginal Inflation Premium. Equivalently,
this may be computed as
the instantaneous rate of growth of the Forward CPI curve.
The nominal zero coupon yield curve minus the real zero coupon
yield curve for any given date gives the Average Inflation Premium.
Equivalently, this may be computed as the average rate of growth
of the Forward CPI curve.
The Marginal and Average Inflation Premia are plotted together
above, again with a 2.5 month lag to allow
for the indexation lag. These two curves bear the same
mathematical relationship to one another as do the the Forward
and Zero Coupon yield curves, or as do a Marginal and Average
Cost Curve.
In a world of complete markets, zero transactions costs,
and perfect foresight,
the Marginal Inflation Premium must equal the future rate of inflation,
after adjustment for the indexation lag.
In a world of complete markets, zero transactions costs, and risk neutrality,
the reciprocal Forward CPI should equal the expected future
reciprocal CPI (Fischer 1975). This in turn implies that the
Marginal Inflation Premium will reflect on a weighted average of future
conditional inflation rates, conditional on the future price level,
weighted both by the probability of the future price level in question
and by the reciprocal of that future price level (Kochin 1980,
McCulloch and Kochin 1998). At short horizons,
this is essentially the expected future inflation rate, but at longer
horizons, it gives much greater weight to low-inflation scenarios.
With risk aversion and positive transactions costs, the Marginal
Inflation Premium may further contain
- a (positive) risk premium compensating holders of nominal bonds
for risk of high inflation,
- a (negative) risk premium compensating issuers of nominal bonds for
risk of low inflation, and
- a (negative) liquidity premium foregone by holders of nominal
bonds, in exchange for their greater liquidity.
- differential tax effects.
I originally used selected on-the-run nominal Treasury securities
to compute a Comparison Nominal Term Structure against which to
compare the Real Term Structure. However, as I document on my new webpage,
The "Bellwether" 30-year Treasury Bond is an
Exceptionally Bad Buy, this is not a reasonable comparison,
since informed investors who are committed to buying an approximately
3-decade nominal Treasury should be avoiding the new bond and buying an
approximately 28 year bond instead. Beginning in February of 2000, the
comparisons on this page are therefore made to selected high-yield Treasury securities
of approximately the same maturity as the indexed bonds used.
For this purpose, on-the-run issues will be avoided if they appear
to have lower asked yields than nearby off-the-run, reasonably liquid,
non-callable issues. Earlier data have been revised retroactively,
somewhat increasing the nominal comparison rates and the
implied inflation premium, but leaving the real rates unchanged.
Comparing TIPS to low-yield on-the-run Treasuries would make nominals look
even worse, in comparison to TIPS, than they already are.
Return to top of this page
Continuous Compounding
All yields and inflation rates reported here are
computed on a continuous compounding basis, unless otherwise noted. A
continously compounded rate R may be converted
to a bond-equivalent (or semiannually compounded
or coupon-equivalent)
rate B by means of the formula:
B = 200 * [exp(R / 200) - 1]
when B and R are both expressed as a percent per annum.
For example, the bond equivalent rate for a continuously compounded
rate of 5.000% is 5.063%.
In terms of continuous compounding, a "10% gain" followed by a "10% loss"
would leave you where you started, whereas in terms of annual compounding,
these changes would leave you with a net loss of 1%, since (1.10)(0.90) = 0.99.
Return to top of this page
References
Fischer, Stanley. "The Demand for Indexed Bonds," Journal
of Political Economy 83: 509-34.
Kochin, Levis A. "Interest Rates and Uncertain Future Price Levels,"
University of Washington Working Paper, 1980.
McCulloch, J. Huston. "PLAMS: Affordable Mortgages from Inflation-Proof
Deposits," Federal Home Loan Bank of Cincinnati Quarterly Review
1982 #3, pp. 2-6.
McCulloch, J. Huston. "Risk Characteristics and Underwriting Standards
for Price Level Adjusted Mortgages versus other Mortgage Instruments,"
Housing Finance Review vol. 5 (1986), pp. 65-97.
McCulloch, J. Huston and Levis A. Kochin. "The Inflation Premium
Implicit in the U.S.
Real and Nominal Term Structures of Interest Rates," Ohio State
University Working Paper No. 98-12, revised 9/2000.
PDF version.
Websites
Daily, Glenn, "I Bonds: A no-brainer alternative to fixed
annuities?"
Harcourt College website on Interest Rates, with extensive section on
Inflation-Indexed Securities.
Return to top of this page
Up to JHM home page
Over to McCulloch-Kwon Nominal Term Structure Data, 1947-91
This page written and maintained by J. Huston McCulloch, at
mcculloch.2@osu.edu
WTC Flag image courtesy
www.geocities.com/usflagpics/home.html
If you have trouble accessing this page, contact J. Huston McCulloch, at mcculloch.2@osu.edu.
Views and numerical estimates presented on this page are solely those
of the author and are not endorsed by the Ohio State University,
nor by its Departments of Economics or Finance.
Graphs and data may be reproduced in electronic or printed form,
provided the author and this website are cited as its source
and the copyright notice incorporated.
No warranty for use of this data is implied.
Updated 11/18/09.
It is anticipated that this page will be updated with new data
monthly.
This site had 25,223 visitors, 12/18/00 to 7/7/03,
and 9,369 visitors, 11/1/04 - 12/26/05.
Annoying "free" hitcounter removed 12/26/05.


